
USD/JPY: updating record highs
08 March 2021, 12:08

| Scenario | |
|---|---|
| Timeframe | Intraday |
| Recommendation | BUY STOP |
| Entry Point | 108.65 |
| Take Profit | 109.37 |
| Stop Loss | 108.20 |
| Key Levels | 107.00, 107.42, 107.78, 108.15, 108.63, 109.00, 109.37 |
| Alternative scenario | |
|---|---|
| Recommendation | SELL STOP |
| Entry Point | 108.10 |
| Take Profit | 107.00 |
| Stop Loss | 108.80 |
| Key Levels | 107.00, 107.42, 107.78, 108.15, 108.63, 109.00, 109.37 |
Current trend
USD continues to trade against JPY with an uptrend; however, the instrument's activity remains rather low at the beginning of the week, as investors expect new drivers to appear on the market. The strong macroeconomic statistics from the US released last Friday supported the USD "bulls", which are already showing record results.
Today, the focus of Japanese investors is on macroeconomic statistics from Japan, which precede the publication of updated data on Japan's GDP dynamics for Q4 2020, scheduled for Tuesday. The volume of bank lending in February increased by 6.2% YoY after growing by 6.1% YoY in the previous month. In turn, the Current Account (not seasonally adjusted) in January fell from JPY 1165.6B to JPY 646.8B, which turned out to be significantly worse than the optimistic forecasts of growth to JPY 1229.6B.
Support and resistance
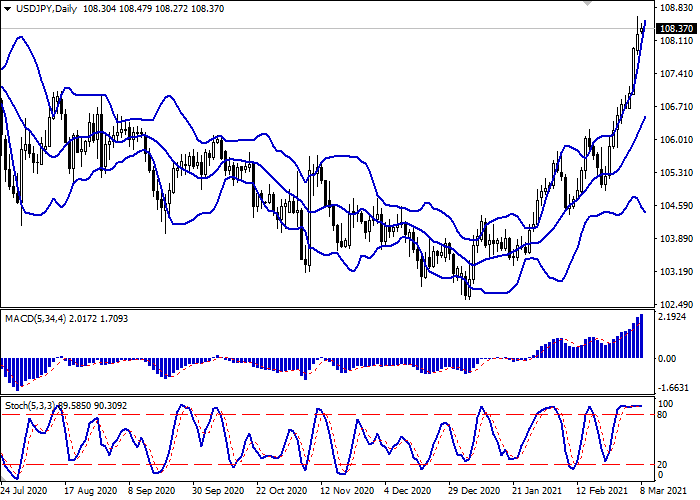
Bollinger Bands in D1 chart show stable growth. The price range is expanding but it fails to conform to the development of "bullish" sentiments at the moment. MACD indicator is growing preserving a stable buy signal (located above the signal line). Stochastic, having reached its highs has been showing flat dynamics for a long time, signaling the risks of overbought USD in the ultra-short term.
Existing long positions should be kept until technical indicators are clarified.
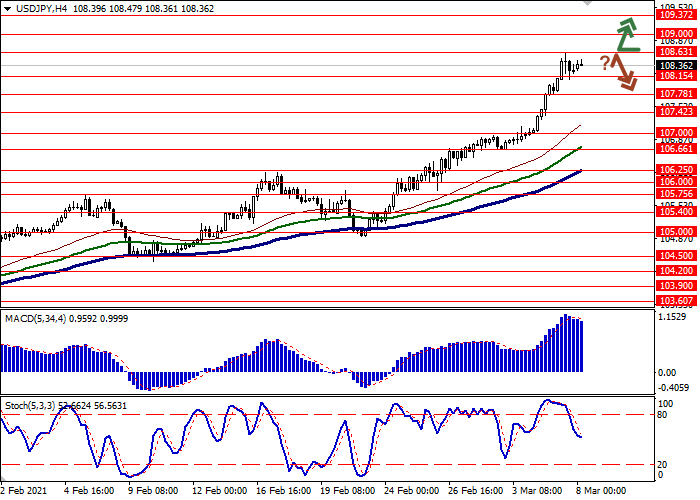
Resistance levels: 108.63, 109.00, 109.37.
Support levels: 108.15, 107.78, 107.42, 107.00.
Trading tips
To open long positions, one can rely on the breakout of 108.63. Take-profit – 109.37. Stop-loss – 108.20. Implementation time: 1-2 days.
A rebound from 108.63 as from resistance, followed by a breakdown of 108.15 may become a signal for new sales with the target at 107.00. Stop loss – 108.80.


No comments:
Write comments