
GBP/USD: wave analysis
08 March 2021, 12:05

| Scenario | |
|---|---|
| Timeframe | Weekly |
| Recommendation | SELL |
| Entry Point | 1.3830 |
| Take Profit | 1.3573, 1.3162 |
| Stop Loss | 1.4022 |
| Key Levels | 1.3162, 1.3573, 1.4022, 1.4246, 1.4400 |
| Alternative scenario | |
|---|---|
| Recommendation | BUY STOP |
| Entry Point | 1.4025 |
| Take Profit | 1.4246, 1.4400 |
| Stop Loss | 1.3950 |
| Key Levels | 1.3162, 1.3573, 1.4022, 1.4246, 1.4400 |
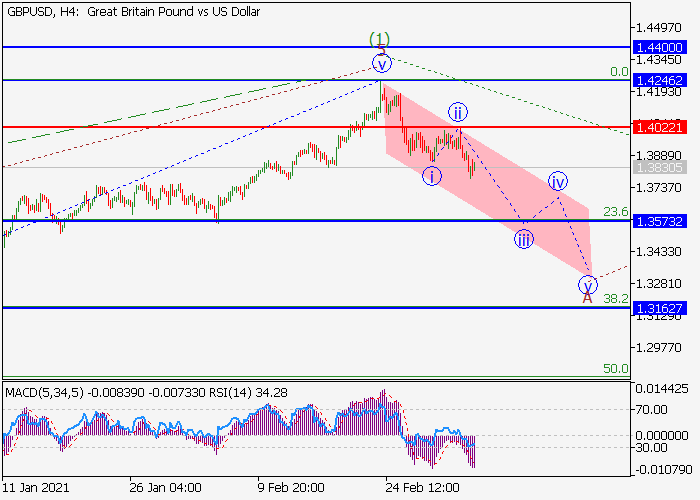
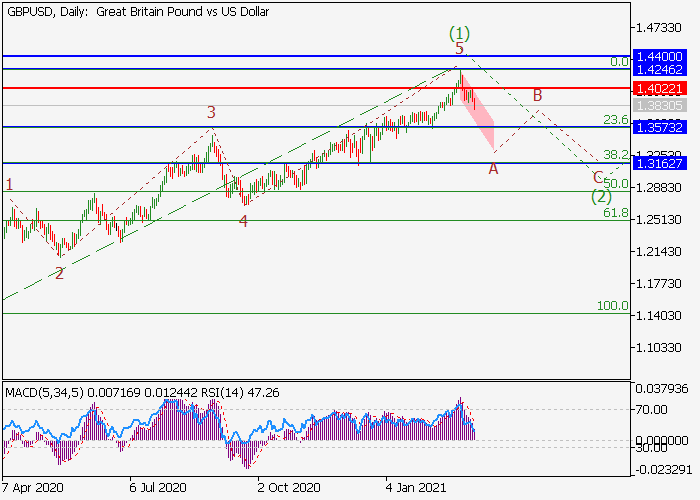
The probability of the pair reduction remains.
On the daily chart, the development of the first wave of the higher level (1) has completed, which included wave 5 of (1). At the moment, the development of a downward correction has begun as wave (2), which includes the formation of wave A of (2). If the assumption is correct, the decline of the pair will continue to the levels of 1.3573–1.3162. The level of 1.4022 is critical and stop-loss for this scenario.
Main scenario
Short positions are relevant from corrections below the level of 1.4022 with targets at 1.3573–1.3162. Implementation time: 7 days and more.
Alternative scenario
Breakout and consolidation of the price above the level of 1.4022 will help the pair continue growth to the levels of 1.4246–1.4400.


No comments:
Write comments