
AUD/USD: the instrument resumed growth
19 January 2021, 11:45
| Scenario | |
|---|---|
| Timeframe | Intraday |
| Recommendation | BUY STOP |
| Entry Point | 0.7757 |
| Take Profit | 0.7818, 0.7840 |
| Stop Loss | 0.7700 |
| Key Levels | 0.7600, 0.7640, 0.7675, 0.7700, 0.7725, 0.7757, 0.7780, 0.7818 |
| Alternative scenario | |
|---|---|
| Recommendation | SELL STOP |
| Entry Point | 0.7700 |
| Take Profit | 0.7640 |
| Stop Loss | 0.7735 |
| Key Levels | 0.7600, 0.7640, 0.7675, 0.7700, 0.7725, 0.7757, 0.7780, 0.7818 |
Current trend
AUD is showing active gains against USD during today's Asian session, recovering from the "bearish" start of the week, which triggered renewal of local lows for the instrument since January 4. Moderate support for the instrument on Tuesday is provided by macroeconomic statistics from Australia. New Home Sales from HIA increased by 32.5% MoM in December after rising by 15.2% MoM in the previous month.
Additional support for AUD is provided by data from China, which were released on Monday. The statistics reflected China's GDP growth in Q4 2020 by impressive 6.5% YoY (considering the raging epidemic), after increasing by 4.9% YoY in the previous period. Analysts had expected growth by 6.1% YoY only. Thus, the only large economy that showed positive dynamics at the end of 2020 was the Chinese one.
Support and resistance
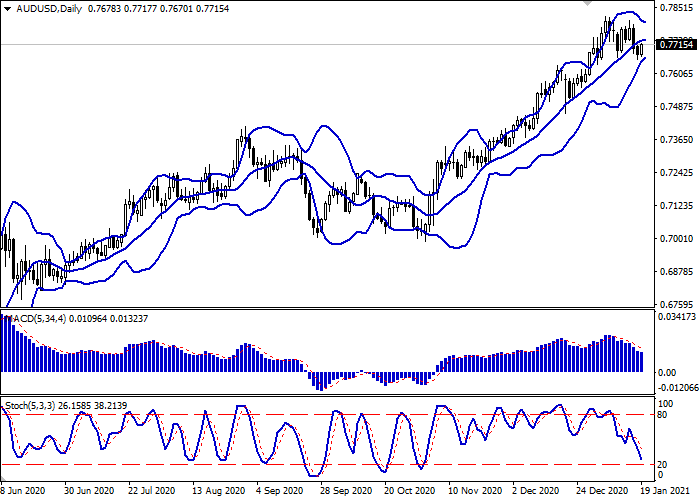
In the D1 chart, Bollinger Bands are reversing horizontally. The price range is narrowing, reflecting flat dynamics of trading in the short term. MACD is going down keeping a fairly stable sell signal (located below the signal line). Stochastic is showing similar dynamics; however, the indicator line is already approaching its lows, indicating the risks of oversold instrument in the ultra-short term.
Technical indicators do not contradict the further development of the downtrend in the short and/or ultra-short term.
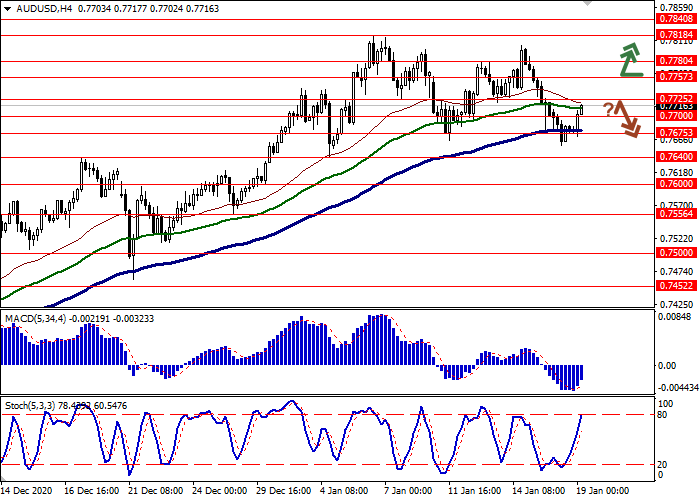
Resistance levels: 0.7725, 0.7757, 0.7780, 0.7818.
Support levels: 0.7700, 0.7675, 0.7640, 0.7600.

Trading tips
To open long positions, one can rely on the breakout of 0.7757. Take-profit – 0.7818–0.7840. Stop-loss – 0.7700. Implementation time: 2-3 days.
A rebound from 0.7725 as from resistance, followed by a breakdown of 0.7700 may become a signal for new sales with the target at 0.7640. Stop-loss – 0.7735.


No comments:
Write comments