
USD/CAD: the instrument shows flat trades
19 January 2021, 11:40

| Scenario | |
|---|---|
| Timeframe | Intraday |
| Recommendation | BUY STOP |
| Entry Point | 1.2740 |
| Take Profit | 1.2800 |
| Stop Loss | 1.2700 |
| Key Levels | 1.2600, 1.2622, 1.2664, 1.2700, 1.2738, 1.2766, 1.2800, 1.2850 |
| Alternative scenario | |
|---|---|
| Recommendation | SELL STOP |
| Entry Point | 1.2695 |
| Take Profit | 1.2622 |
| Stop Loss | 1.2738 |
| Key Levels | 1.2600, 1.2622, 1.2664, 1.2700, 1.2738, 1.2766, 1.2800, 1.2850 |
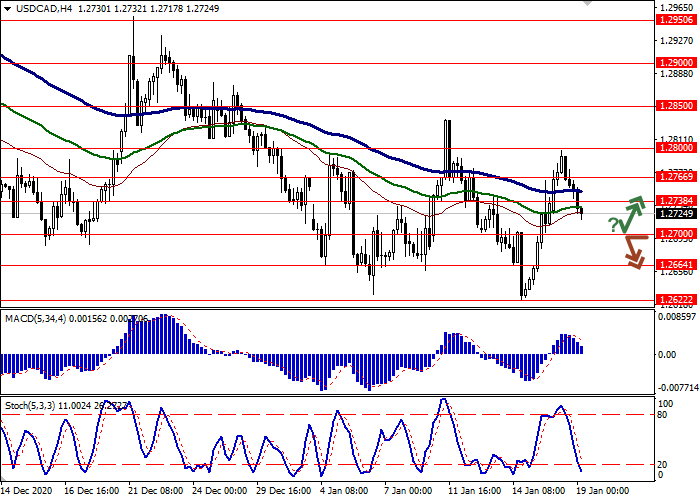
Current trend
Today, during the Asian session, the USD/CAD pair is declining, offsetting yesterday's growth, which allowed renewing local highs since January 11.
Markets await tomorrow's inauguration of US President Joe Biden and are tracking possible changes to the country's agenda. In particular, it is expected that Biden in his early days in office will issue a decree on the return of the US to the Paris climate agreement, lift the ban on entering the country for countries with a Muslim majority and pass several other important bills.
Monday’s Canadian Macroeconomic statistics were ambiguous. Thus, Housing starts for December slowed down from 259.9K to 228.3K, which, however, was slightly better than the market expectations of 225K. Meanwhile, for November, foreigners increased the volume of purchases of Canadian securities from the previous $6.93 billion to $11.78 billion. The volume of investments in foreign securities, on the contrary, decreased from $7.98 billion to $7.58 billion.
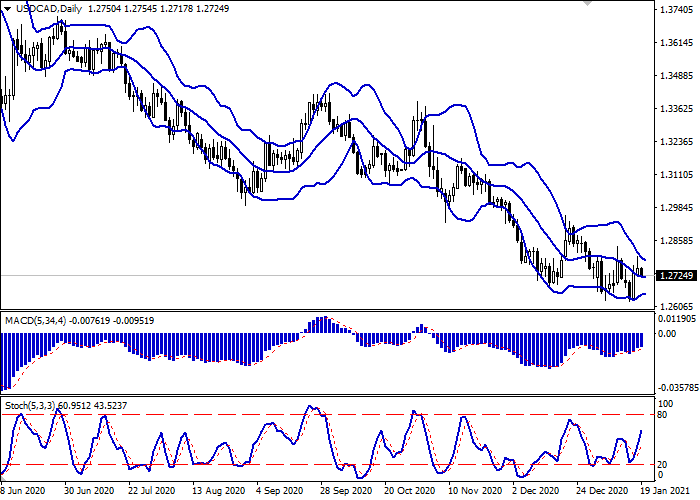
Support and resistance
On the daily chart, Bollinger Bands reverse into a horizontal plane. The price range narrows from the top, indicating ambiguous trading in the short term. MACD grows, maintaining a relatively strong buy signal (the histogram is above the signal line). Stochastic grows more confidently but has not reacted to the resumption of today’s “bearish” dynamics.
It is better to keep the current long positions until the signals from technical indicators are clarified.
Resistance levels: 1.2738, 1.2766, 1.2800, 1.2850.
Support levels: 1.2700, 1.2664, 1.2622, 1.2600.
Trading tips
Long positions may be opened after the rebound from 1.2700 and the breakout of 1.2738 with the target at 1.2800. Stop loss – 1.2700. Implementation period: 2–3 days.
Short positions may be opened after the breakdown of 1.2700 with the target at 1.2622. Stop loss – 1.2738.


No comments:
Write comments