XAU/USD: gold prices are rising
04 December 2019, 09:12
| Scenario | |
|---|---|
| Timeframe | Intraday |
| Recommendation | BUY |
| Entry Point | 1482.61 |
| Take Profit | 1493.88, 1500.00 |
| Stop Loss | 1474.35, 1470.00 |
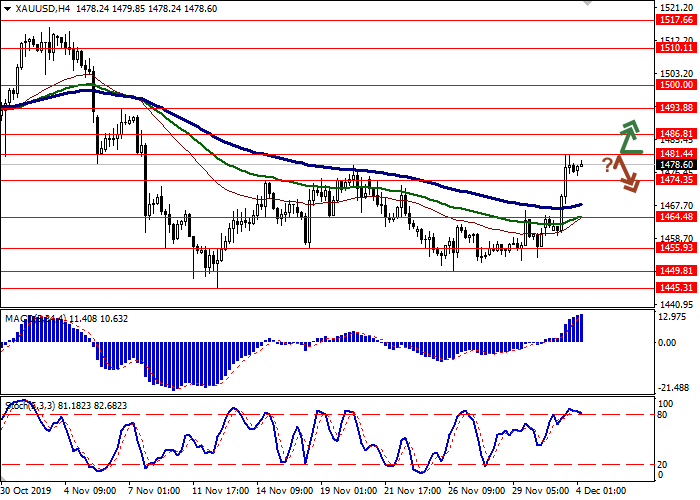
| Key Levels | 1449.81, 1455.93, 1464.48, 1474.35, 1481.44, 1486.81, 1493.88, 1500.00 |
| Alternative scenario | |
|---|---|
| Recommendation | SELL STOP |
| Entry Point | 1474.30 |
| Take Profit | 1455.93 |
| Stop Loss | 1486.81 |
| Key Levels | 1449.81, 1455.93, 1464.48, 1474.35, 1481.44, 1486.81, 1493.88, 1500.00 |
Current trend
Gold prices are stable during today’s Asian session, consolidating near local highs (1481.44), updated the day before. The growth of quotations yesterday was facilitated by investors' flight from risks, after the United States introduced higher tariffs on imports of steel and aluminum from Brazil and Argentina. In addition, investors reacted negatively to the possible postponement of the signing of a trade agreement between the United States and China to November 2020, when the US presidential election will be held. Obviously, this is too long for such an issue, especially considering the speed of change of events in the modern world. Moreover, on December 15, Donald Trump again threatened to increase import duties on Chinese goods, which could put an end to all the progress that had been achieved over a long time.
Support and resistance
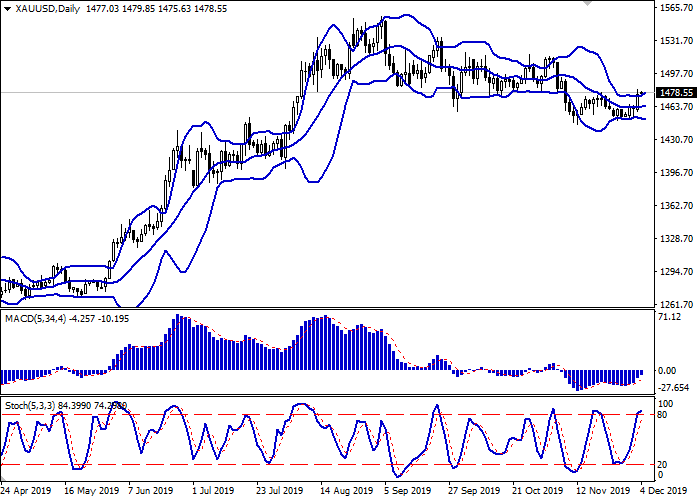
Bollinger Bands in D1 chart show insignificant growth. The price range is expanding, but it fails to catch the development of “bullish” trend at the moment. MACD indicator is growing preserving a moderate buy signal (located above the signal line). Stochastic keeps the uptrend, but approaches its highs rapidly, which indicates the risks associated with overbought instrument in the ultra-short term.
Technical indicators do not contradict the further development of the uptrend in the short and/or ultra-short term.
Resistance levels: 1481.44, 1486.81, 1493.88, 1500.00.
Support levels: 1474.35, 1464.48, 1455.93, 1449.81.


Trading tips
To open long positions, one can rely on the breakout of 1481.44. Take profit – 1493.88 or 1500.00. Stop loss – 1474.35 or 1470.00.
A rebound from 1481.44 as from resistance, followed by a breakdown of 1474.35 may become a signal for new sales with the target at 1455.93. Stop loss – 1486.81.
Implementation time: 2-3 days.
Gold prices are stable during today’s Asian session, consolidating near local highs (1481.44), updated the day before. The growth of quotations yesterday was facilitated by investors' flight from risks, after the United States introduced higher tariffs on imports of steel and aluminum from Brazil and Argentina. In addition, investors reacted negatively to the possible postponement of the signing of a trade agreement between the United States and China to November 2020, when the US presidential election will be held. Obviously, this is too long for such an issue, especially considering the speed of change of events in the modern world. Moreover, on December 15, Donald Trump again threatened to increase import duties on Chinese goods, which could put an end to all the progress that had been achieved over a long time.
Support and resistance
Bollinger Bands in D1 chart show insignificant growth. The price range is expanding, but it fails to catch the development of “bullish” trend at the moment. MACD indicator is growing preserving a moderate buy signal (located above the signal line). Stochastic keeps the uptrend, but approaches its highs rapidly, which indicates the risks associated with overbought instrument in the ultra-short term.
Technical indicators do not contradict the further development of the uptrend in the short and/or ultra-short term.
Resistance levels: 1481.44, 1486.81, 1493.88, 1500.00.
Support levels: 1474.35, 1464.48, 1455.93, 1449.81.


Trading tips
To open long positions, one can rely on the breakout of 1481.44. Take profit – 1493.88 or 1500.00. Stop loss – 1474.35 or 1470.00.
A rebound from 1481.44 as from resistance, followed by a breakdown of 1474.35 may become a signal for new sales with the target at 1455.93. Stop loss – 1486.81.
Implementation time: 2-3 days.


No comments:
Write comments