EUR/USD: the euro is showing flat dynamics
04 December 2019, 08:58
| Scenario | |
|---|---|
| Timeframe | Intraday |
| Recommendation | BUY STOP |
| Entry Point | 1.1100 |
| Take Profit | 1.1138, 1.1150 |
| Stop Loss | 1.1070, 1.1065 |
| Key Levels | 1.1000, 1.1024, 1.1042, 1.1062, 1.1095, 1.1117, 1.1138, 1.1174 |
| Alternative scenario | |
|---|---|
| Recommendation | SELL STOP |
| Entry Point | 1.1060 |
| Take Profit | 1.1024, 1.1000 |
| Stop Loss | 1.1085, 1.1095 |
| Key Levels | 1.1000, 1.1024, 1.1042, 1.1062, 1.1095, 1.1117, 1.1138, 1.1174 |
Current trend
EUR shows a slight decline against USD during today's Asian session, losing about 0.04%. The pair continues to consolidate near local highs at the level of 1.1092, updated the day before amid conflicting external factors. Moderate support for the euro is provided by positive macroeconomic indicators on Manufacturing PMIs, which were released on Monday.
Tuesday's data turned out to be significantly more restrained. Producer Price Index in October showed an increase of 0.1% MoM, which coincided with the dynamics of the previous month. In annual terms, production inflation fell by 1.9% YoY after falling by 1.2% YoY in September. During the day, investors expect the publication of European Services PMI, which will later be compared with similar statistics from the United States.
Support and resistance
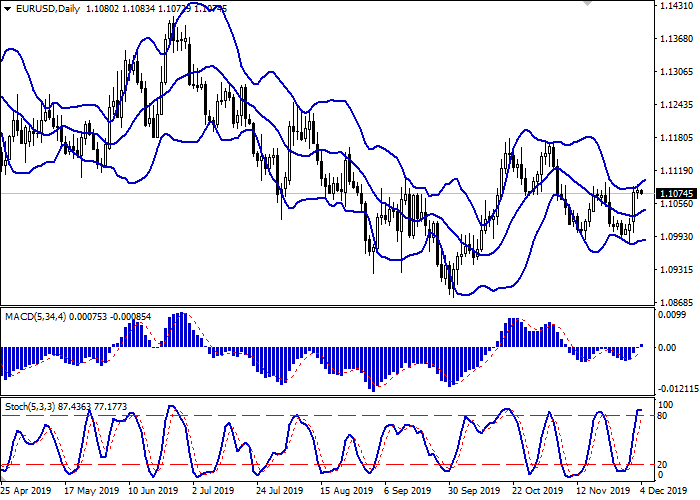
Bollinger Bands in D1 chart show moderate growth. The price range expands slightly from above, freeing a path to new local highs for the “bulls”. MACD indicator is growing preserving a moderate buy signal (located above the signal line). Stochastic, having reached its highs, reversed into the horizontal plane, which indicates the risks of the formation of correctional dynamics due to the overbought euro in the ultra-short term.
It is necessary to wait for the trade signals from technical indicators to become clear. Some of the existing long positions should be kept for some time.
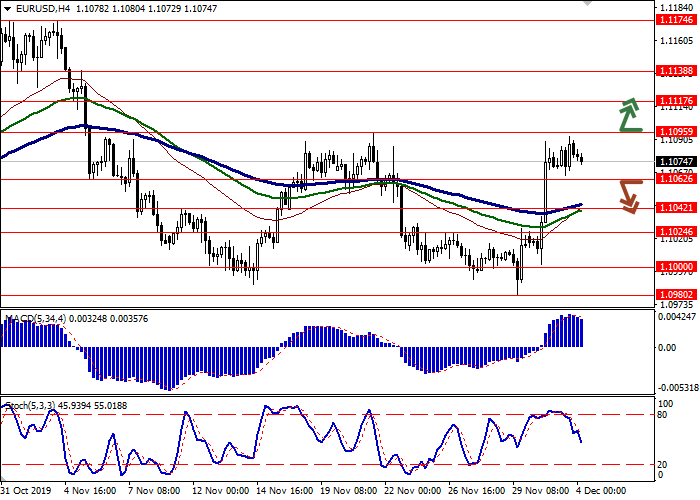
Resistance levels: 1.1095, 1.1117, 1.1138, 1.1174.
Support levels: 1.1062, 1.1042, 1.1024, 1.1000.


Trading tips
To open long positions, one can rely on the breakout of 1.1095. Take profit – 1.1138 or 1.1150. Stop loss – 1.1070 or 1.1065.
A breakdown of 1.1062 may be a signal for new sales with target at 1.1024 or 1.1000. Stop loss – 1.1085 or 1.1095.
Implementation time: 2-3 days.
EUR shows a slight decline against USD during today's Asian session, losing about 0.04%. The pair continues to consolidate near local highs at the level of 1.1092, updated the day before amid conflicting external factors. Moderate support for the euro is provided by positive macroeconomic indicators on Manufacturing PMIs, which were released on Monday.
Tuesday's data turned out to be significantly more restrained. Producer Price Index in October showed an increase of 0.1% MoM, which coincided with the dynamics of the previous month. In annual terms, production inflation fell by 1.9% YoY after falling by 1.2% YoY in September. During the day, investors expect the publication of European Services PMI, which will later be compared with similar statistics from the United States.
Support and resistance
Bollinger Bands in D1 chart show moderate growth. The price range expands slightly from above, freeing a path to new local highs for the “bulls”. MACD indicator is growing preserving a moderate buy signal (located above the signal line). Stochastic, having reached its highs, reversed into the horizontal plane, which indicates the risks of the formation of correctional dynamics due to the overbought euro in the ultra-short term.
It is necessary to wait for the trade signals from technical indicators to become clear. Some of the existing long positions should be kept for some time.
Resistance levels: 1.1095, 1.1117, 1.1138, 1.1174.
Support levels: 1.1062, 1.1042, 1.1024, 1.1000.


Trading tips
To open long positions, one can rely on the breakout of 1.1095. Take profit – 1.1138 or 1.1150. Stop loss – 1.1070 or 1.1065.
A breakdown of 1.1062 may be a signal for new sales with target at 1.1024 or 1.1000. Stop loss – 1.1085 or 1.1095.
Implementation time: 2-3 days.


No comments:
Write comments