
XAU/USD: gold prices are going down
13 December 2019, 09:30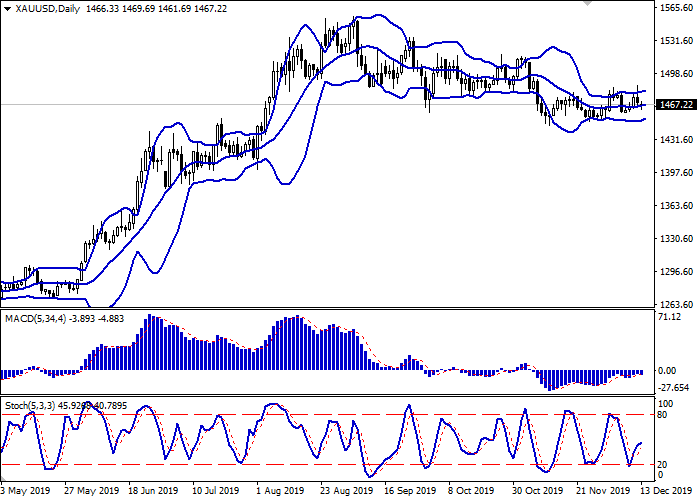
| Scenario | |
|---|---|
| Timeframe | Intraday |
| Recommendation | BUY STOP |
| Entry Point | 1471.20 |
| Take Profit | 1481.44, 1486.81 |
| Stop Loss | 1465.07 |
| Key Levels | 1449.81, 1455.93, 1461.69, 1465.07, 1471.15, 1475.82, 1481.44, 1486.81 |
| Alternative scenario | |
|---|---|
| Recommendation | SELL STOP |
| Entry Point | 1465.00 |
| Take Profit | 1455.93, 1449.81 |
| Stop Loss | 1471.15 |
| Key Levels | 1449.81, 1455.93, 1461.69, 1465.07, 1471.15, 1475.82, 1481.44, 1486.81 |
Current trend
Gold prices are slightly decreasing during today’s Asian session, losing about 0.12%. The instrument develops an uncertain “bearish” impulse, which was supported by Donald Trump's statements on Twitter that the US and China are close to concluding a trade deal. The issue of increasing import duties on December 15 remains open. Nevertheless, there is information in the media that indicates Washington’s readiness to abandon the introduction of new tariffs. Moreover, investors are hoping to reduce some of the existing import duties. Finally, the first results of parliamentary elections in the UK contribute to the development of negative dynamics in gold. As expected, the Conservative Party is gaining a landslide victory, which will allow it to gain an overwhelming majority in parliament.
Support and resistance
Bollinger Bands in D1 chart demonstrate flat dynamics. The price range is slightly changing, reflecting ambiguous dynamics of trading in the short term. MACD has reversed downwards but it retains its previous buy signal (located above the signal line). Stochastic also shows growth, only slightly reacting to the appearance of “bearish” trend at the end of the current trading week.
One should wait for clarification of the situation to open new transactions.
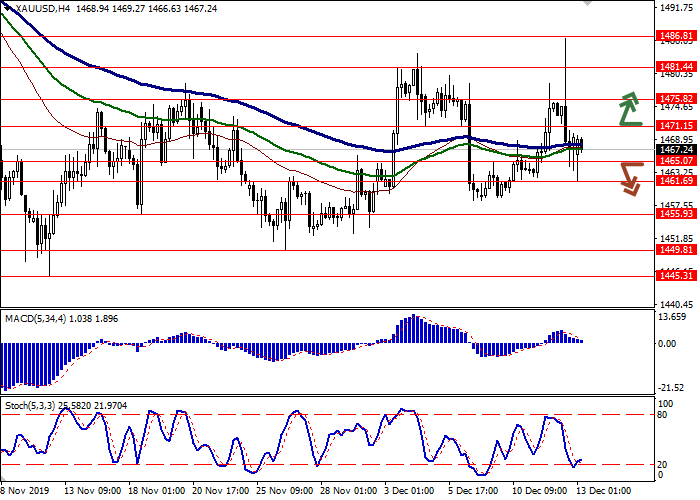
Resistance levels: 1471.15, 1475.82, 1481.44, 1486.81.
Support levels: 1465.07, 1461.69, 1455.93, 1449.81.

Trading tips
To open long positions, one can rely on the breakout of 1471.15. Take profit – 1481.44 or 1486.81. Stop loss – 1465.07.
A breakdown of 1465.07 may be a signal for new sales with target at 1455.93 or 1449.81. Stop loss – 1471.15.
Implementation time: 2-3 days.
Gold prices are slightly decreasing during today’s Asian session, losing about 0.12%. The instrument develops an uncertain “bearish” impulse, which was supported by Donald Trump's statements on Twitter that the US and China are close to concluding a trade deal. The issue of increasing import duties on December 15 remains open. Nevertheless, there is information in the media that indicates Washington’s readiness to abandon the introduction of new tariffs. Moreover, investors are hoping to reduce some of the existing import duties. Finally, the first results of parliamentary elections in the UK contribute to the development of negative dynamics in gold. As expected, the Conservative Party is gaining a landslide victory, which will allow it to gain an overwhelming majority in parliament.
Support and resistance
Bollinger Bands in D1 chart demonstrate flat dynamics. The price range is slightly changing, reflecting ambiguous dynamics of trading in the short term. MACD has reversed downwards but it retains its previous buy signal (located above the signal line). Stochastic also shows growth, only slightly reacting to the appearance of “bearish” trend at the end of the current trading week.
One should wait for clarification of the situation to open new transactions.
Resistance levels: 1471.15, 1475.82, 1481.44, 1486.81.
Support levels: 1465.07, 1461.69, 1455.93, 1449.81.
Trading tips
To open long positions, one can rely on the breakout of 1471.15. Take profit – 1481.44 or 1486.81. Stop loss – 1465.07.
A breakdown of 1465.07 may be a signal for new sales with target at 1455.93 or 1449.81. Stop loss – 1471.15.
Implementation time: 2-3 days.


No comments:
Write comments