Brent Crude Oil: oil prices consolidate
06 December 2019, 11:10
| Scenario | |
|---|---|
| Timeframe | Intraday |
| Recommendation | BUY |
| Entry Point | 64.06 |
| Take Profit | 65.00, 65.30 |
| Stop Loss | 63.30 |
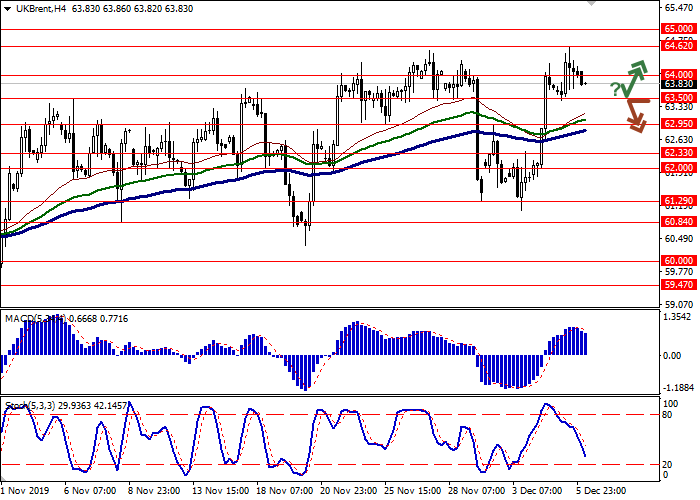
| Key Levels | 62.00, 62.33, 62.95, 63.50, 64.00, 64.62, 65.00 |
| Alternative scenario | |
|---|---|
| Recommendation | SELL STOP |
| Entry Point | 63.45 |
| Take Profit | 62.33, 62.00 |
| Stop Loss | 64.30 |
| Key Levels | 62.00, 62.33, 62.95, 63.50, 64.00, 64.62, 65.00 |
Current trend
Today, during the Asian session, oil prices moderately fall, retreating from yesterday's local highs at 64.62. The price is supported moderately by expectations of positive changes after a two-day OPEC meeting, which will end on December 6. The cartel suggests recommending reduce in oil production by an additional 500K barrels per day in 2020 Q1. An additional “bullish” impulse comes from the previously published report on oil reserves from the US Department of Energy. For the week of November 29, oil reserves in the US stocks fell by 4.856 million barrels after an increase of 1.572 million barrels over the past period. Analysts had expected the appearance of negative dynamics but expected only –1.734 million barrels.
On Friday, investors were focused on the publication of the November report on the US labor market and US Baker Hughes Oil Rig Count.
Support and resistance
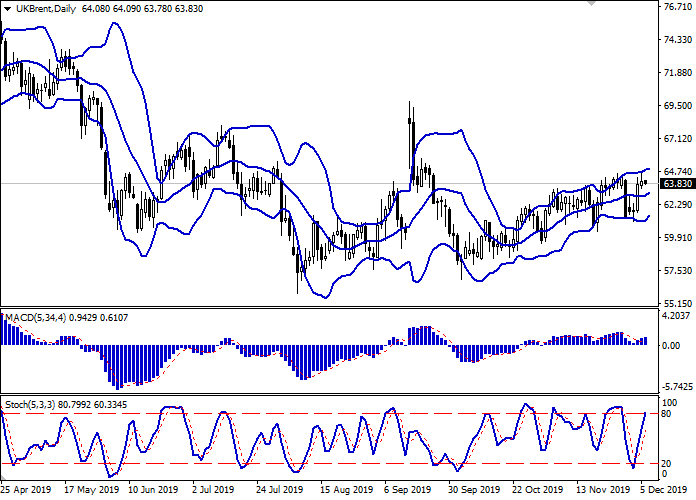
On the daily chart, Bollinger bands grow moderately. The price range sharply narrows from below, reflecting the ambiguous nature of trades in the ultra-short term. MACD grows, maintaining a poor buy signal (the histogram is above the signal line). Stochastic grows but quickly approaches its highs, which indicates the risks of a corrective decline in the ultra-short term.
Current readings of technical indicators do not contradict the further development of an uptrend in the short and/or ultra-short term.
Resistance levels: 64.00, 64.62, 65.00.
Support levels: 63.50, 62.95, 62.33, 62.00.


Trading tips
Long positions may be opened after a rebound from 63.50 and a breakout of 64.00 with the target at 65.00 or 65.30. Stop loss – 63.30. Implementation period: 1–2 days.
Short positions may be opened after the breakdown of 63.50 with the target at 62.33 or 62.00. Stop loss – 64.30. Implementation period: 2–3 days.
Today, during the Asian session, oil prices moderately fall, retreating from yesterday's local highs at 64.62. The price is supported moderately by expectations of positive changes after a two-day OPEC meeting, which will end on December 6. The cartel suggests recommending reduce in oil production by an additional 500K barrels per day in 2020 Q1. An additional “bullish” impulse comes from the previously published report on oil reserves from the US Department of Energy. For the week of November 29, oil reserves in the US stocks fell by 4.856 million barrels after an increase of 1.572 million barrels over the past period. Analysts had expected the appearance of negative dynamics but expected only –1.734 million barrels.
On Friday, investors were focused on the publication of the November report on the US labor market and US Baker Hughes Oil Rig Count.
Support and resistance
On the daily chart, Bollinger bands grow moderately. The price range sharply narrows from below, reflecting the ambiguous nature of trades in the ultra-short term. MACD grows, maintaining a poor buy signal (the histogram is above the signal line). Stochastic grows but quickly approaches its highs, which indicates the risks of a corrective decline in the ultra-short term.
Current readings of technical indicators do not contradict the further development of an uptrend in the short and/or ultra-short term.
Resistance levels: 64.00, 64.62, 65.00.
Support levels: 63.50, 62.95, 62.33, 62.00.


Trading tips
Long positions may be opened after a rebound from 63.50 and a breakout of 64.00 with the target at 65.00 or 65.30. Stop loss – 63.30. Implementation period: 1–2 days.
Short positions may be opened after the breakdown of 63.50 with the target at 62.33 or 62.00. Stop loss – 64.30. Implementation period: 2–3 days.


No comments:
Write comments