XAU/USD: gold prices have stabilized
06 December 2019, 11:09
| Scenario | |
|---|---|
| Timeframe | Intraday |
| Recommendation | BUY STOP |
| Entry Point | 1481.50 |
| Take Profit | 1500.00 |
| Stop Loss | 1471.15 |
| Key Levels | 1449.81, 1455.93, 1464.48, 1471.15, 1481.44, 1486.81, 1493.88, 1500.00 |
| Alternative scenario | |
|---|---|
| Recommendation | SELL STOP |
| Entry Point | 1471.10 |
| Take Profit | 1455.93, 1449.81 |
| Stop Loss | 1481.44 |
| Key Levels | 1449.81, 1455.93, 1464.48, 1471.15, 1481.44, 1486.81, 1493.88, 1500.00 |
Current trend
Gold prices are stable during today’s Asian session, trading near 1475.00. Gold quotes have changed little recently since investors expect the situation to develop in a trade conflict between the United States and China. Earlier this week, information appeared that the conclusion of the agreement may have to be postponed to November 2020, when the next presidential election will be held in the United States. Donald Trump later reiterated that “negotiations are going well,” and moderate optimism gradually began to return to the markets. However, there is little time left until December 15, and new import duties, if they are introduced by the USA, will almost certainly put an end to the current progress in the negotiations and everything will have to be started from scratch.
Support and resistance
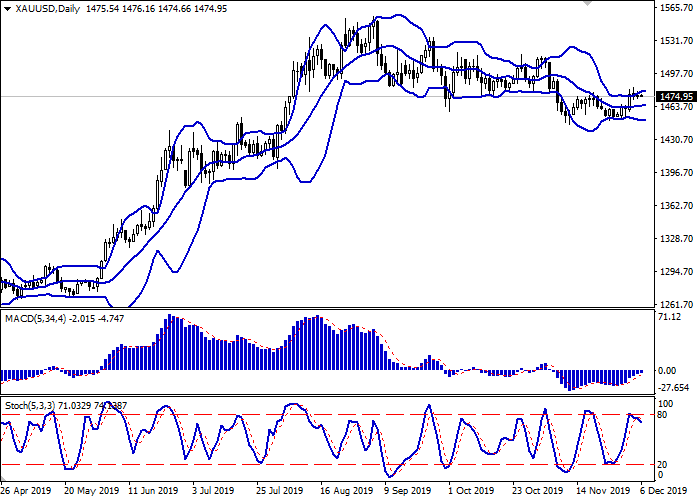
In the D1 chart, Bollinger Bands are reversing horizontally. The price range remains virtually unchanged, limiting the development of the “bullish” sentiment in the ultra-short term. MACD indicator is growing preserving a weak buy signal (located above the signal line). Stochastic, having reached the level of “80”, demonstrates weak correctional dynamics, indicating the possibility of developing a full-fledged downtrend in the nearest time intervals.
It is necessary to wait for the additional signals from technical indicators to open short positions.
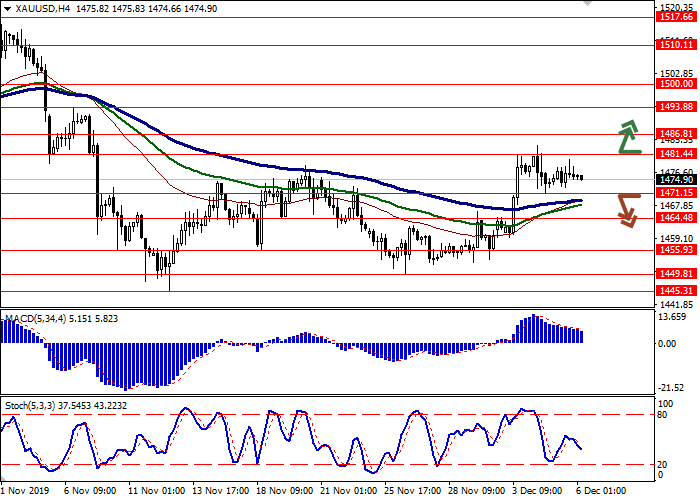
Resistance levels: 1481.44, 1486.81, 1493.88, 1500.00.
Support levels: 1471.15, 1464.48, 1455.93, 1449.81.


Trading tips
To open long positions, one can rely on the breakout of 1481.44. Take profit – 1500.00. Stop loss – 1471.15.
A breakdown of 1471.15 may be a signal for new sales with target at 1455.93 or 1449.81. Stop loss – 1481.44.
Implementation time: 2-3 days.
Gold prices are stable during today’s Asian session, trading near 1475.00. Gold quotes have changed little recently since investors expect the situation to develop in a trade conflict between the United States and China. Earlier this week, information appeared that the conclusion of the agreement may have to be postponed to November 2020, when the next presidential election will be held in the United States. Donald Trump later reiterated that “negotiations are going well,” and moderate optimism gradually began to return to the markets. However, there is little time left until December 15, and new import duties, if they are introduced by the USA, will almost certainly put an end to the current progress in the negotiations and everything will have to be started from scratch.
Support and resistance
In the D1 chart, Bollinger Bands are reversing horizontally. The price range remains virtually unchanged, limiting the development of the “bullish” sentiment in the ultra-short term. MACD indicator is growing preserving a weak buy signal (located above the signal line). Stochastic, having reached the level of “80”, demonstrates weak correctional dynamics, indicating the possibility of developing a full-fledged downtrend in the nearest time intervals.
It is necessary to wait for the additional signals from technical indicators to open short positions.
Resistance levels: 1481.44, 1486.81, 1493.88, 1500.00.
Support levels: 1471.15, 1464.48, 1455.93, 1449.81.


Trading tips
To open long positions, one can rely on the breakout of 1481.44. Take profit – 1500.00. Stop loss – 1471.15.
A breakdown of 1471.15 may be a signal for new sales with target at 1455.93 or 1449.81. Stop loss – 1481.44.
Implementation time: 2-3 days.


No comments:
Write comments