AUD/USD: general review
06 December 2019, 11:13
| Scenario | |
|---|---|
| Timeframe | Weekly |
| Recommendation | BUY STOP |
| Entry Point | 0.6855 |
| Take Profit | 0.6900 |
| Stop Loss | 0.6830 |
| Key Levels | 0.6780, 0.6820, 0.6855, 0.6900 |
| Alternative scenario | |
|---|---|
| Recommendation | SELL STOP |
| Entry Point | 0.6820 |
| Take Profit | 0.6780 |
| Stop Loss | -0.6840 |
| Key Levels | 0.6780, 0.6820, 0.6855, 0.6900 |
Current trend
This week has been filled with a variety of macroeconomic data from the Australian National Bureau of Statistics. On Tuesday, the Reserve Bank left the interest rate at the same level of 0.75% for the third time in a row after a September decrease of 0.25%, which inspired positive investors. However, negative releases came out on Wednesday: GDP showed a slowdown from 0.5% last month to 0.4% this month, while retail sales remained at 0% against the expected value of 0.3%. Today, the US dollar may be affected by the publication of the unemployment rate. Although analysts expect the index to remain unchanged, there are concerns that it will increase based on poor data on Nonfarm Payrolls published on Tuesday.
Despite the poor positions of the American currency, the Australian dollar is also not a strong asset, which forces the currency pair to consolidate within a narrow range.
Support and resistance
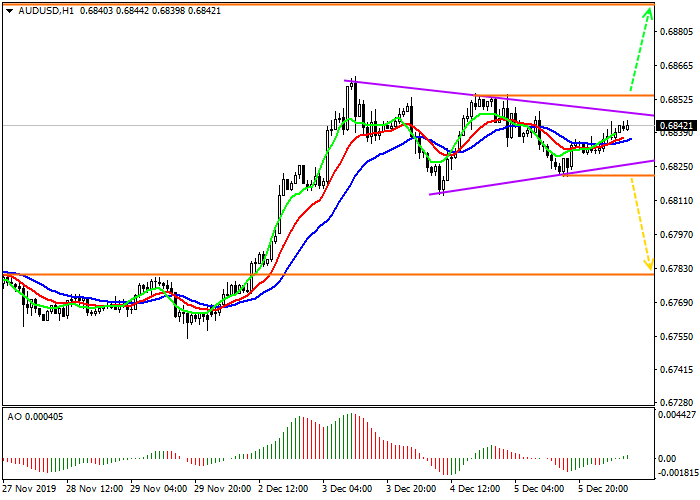
The classic “triangle” pattern is formed on the chart, which is quite expected in the current situation of uncertainty in the macroeconomics. According to statistics, the patter may end with growth but pending sell orders should also not be excluded.
Support levels: 0.6820, 0.6780.
Resistance levels: 0.6855, 0.6900.

Trading tips
In case of growth and consolidation above the level of 0.6855, both previously opened and new buy positions with the target at 0.6900 will be relevant. Stop loss needs to be moved beyond the line of resistance of the pattern, around 0.6830.
If the asset decreases and the price fixes below the local minimum and the support line at 0.6820, it is better to open sell positions with the target at 0.6780 and stop loss 0.6840 located inside the pattern.
Implementation period: 7 days or more.
This week has been filled with a variety of macroeconomic data from the Australian National Bureau of Statistics. On Tuesday, the Reserve Bank left the interest rate at the same level of 0.75% for the third time in a row after a September decrease of 0.25%, which inspired positive investors. However, negative releases came out on Wednesday: GDP showed a slowdown from 0.5% last month to 0.4% this month, while retail sales remained at 0% against the expected value of 0.3%. Today, the US dollar may be affected by the publication of the unemployment rate. Although analysts expect the index to remain unchanged, there are concerns that it will increase based on poor data on Nonfarm Payrolls published on Tuesday.
Despite the poor positions of the American currency, the Australian dollar is also not a strong asset, which forces the currency pair to consolidate within a narrow range.
Support and resistance
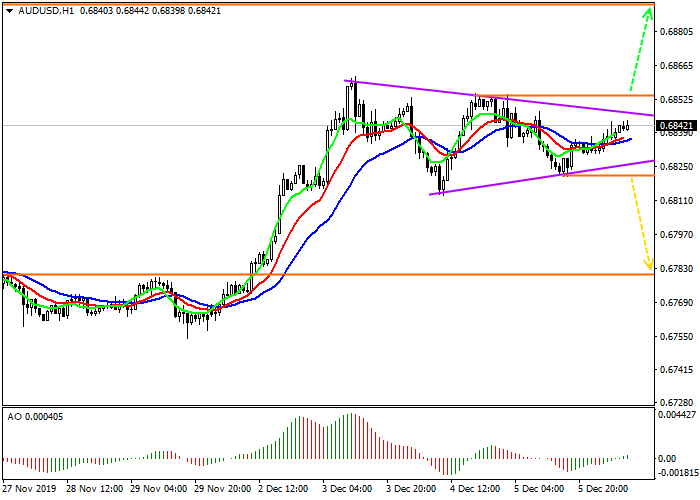
The classic “triangle” pattern is formed on the chart, which is quite expected in the current situation of uncertainty in the macroeconomics. According to statistics, the patter may end with growth but pending sell orders should also not be excluded.
Support levels: 0.6820, 0.6780.
Resistance levels: 0.6855, 0.6900.

Trading tips
In case of growth and consolidation above the level of 0.6855, both previously opened and new buy positions with the target at 0.6900 will be relevant. Stop loss needs to be moved beyond the line of resistance of the pattern, around 0.6830.
If the asset decreases and the price fixes below the local minimum and the support line at 0.6820, it is better to open sell positions with the target at 0.6780 and stop loss 0.6840 located inside the pattern.
Implementation period: 7 days or more.


No comments:
Write comments