AUD/USD: the instrument is consolidating
09 December 2019, 12:00
| Scenario | |
|---|---|
| Timeframe | Intraday |
| Recommendation | BUY |
| Entry Point | 0.6835 |
| Take Profit | 0.6864, 0.6881 |
| Stop Loss | 0.6810, 0.6800 |
| Key Levels | 0.6768, 0.6782, 0.6800, 0.6819, 0.6833, 0.6846, 0.6864, 0.6881 |
| Alternative scenario | |
|---|---|
| Recommendation | SELL STOP |
| Entry Point | 0.6815 |
| Take Profit | 0.6782, 0.6768 |
| Stop Loss | 0.6846 |
| Key Levels | 0.6768, 0.6782, 0.6800, 0.6819, 0.6833, 0.6846, 0.6864, 0.6881 |
Current trend
AUD is trading near the opening level (0.6829) against USD during today's Asian session. Investors are in no hurry to open new trading positions, preferring to wait for new drivers to appear at the market. Monday's macroeconomic background is rather scarce, but on Tuesday there will be a lot of interesting statistics from Australia and China. On Wednesday, the United States will be in the spotlight with the publication of November statistics on Consumer Inflation and the Fed meeting.
In the meantime, investors are taking a lead from the publication of a strong US labor market report for November last Friday. Nonfarm Payrolls in November increased by 266K after the growth by 156K in the previous month. Analysts had expected an increase of 180K.
Support and resistance
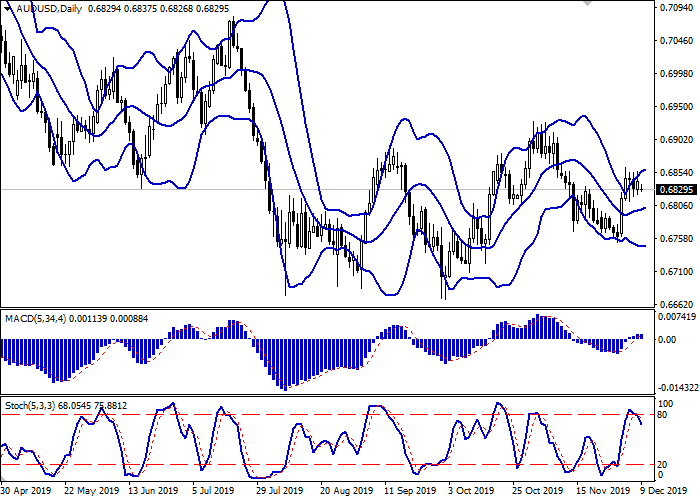
Bollinger Bands in D1 chart show moderate growth. The price range expands slightly, freeing a path to new local highs for the “bulls”. MACD indicator is growing preserving a weak buy signal (located above the signal line). Stochastic reversed downwards, pointing to the risks of a corrective decline in the ultra-short term.
It is worth looking into the possibility of corrective decline in the short and/or ultra-short term.
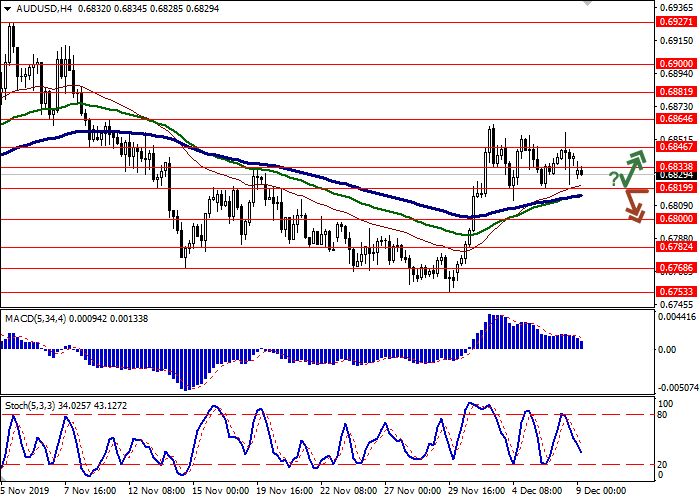
Resistance levels: 0.6833, 0.6846, 0.6864, 0.6881.
Support levels: 0.6819, 0.6800, 0.6782, 0.6768.


Trading tips
To open long positions, one can rely on the rebound from the support level of 0.6819, with the subsequent breakout of 0.6833. Take profit – 0.6864 or 0.6881. Stop loss – 0.6810 or 0.6800.
A breakdown of 0.6819 may be a signal for new sales with target at 0.6782 or 0.6768. Stop loss – 0.6846.
Implementation time: 2-3 days.
AUD is trading near the opening level (0.6829) against USD during today's Asian session. Investors are in no hurry to open new trading positions, preferring to wait for new drivers to appear at the market. Monday's macroeconomic background is rather scarce, but on Tuesday there will be a lot of interesting statistics from Australia and China. On Wednesday, the United States will be in the spotlight with the publication of November statistics on Consumer Inflation and the Fed meeting.
In the meantime, investors are taking a lead from the publication of a strong US labor market report for November last Friday. Nonfarm Payrolls in November increased by 266K after the growth by 156K in the previous month. Analysts had expected an increase of 180K.
Support and resistance
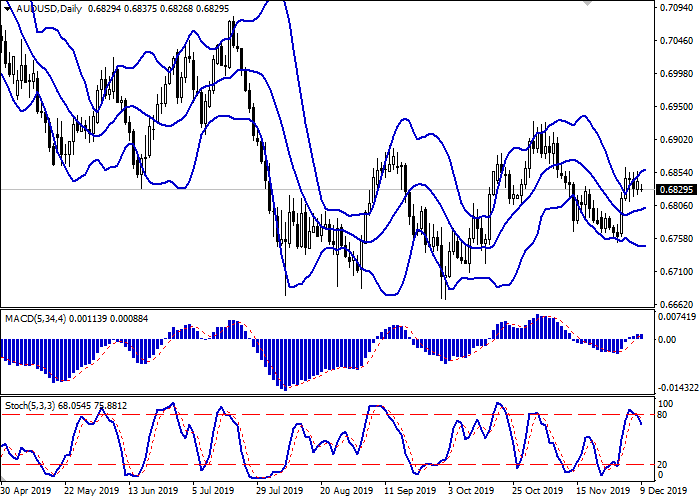
Bollinger Bands in D1 chart show moderate growth. The price range expands slightly, freeing a path to new local highs for the “bulls”. MACD indicator is growing preserving a weak buy signal (located above the signal line). Stochastic reversed downwards, pointing to the risks of a corrective decline in the ultra-short term.
It is worth looking into the possibility of corrective decline in the short and/or ultra-short term.
Resistance levels: 0.6833, 0.6846, 0.6864, 0.6881.
Support levels: 0.6819, 0.6800, 0.6782, 0.6768.


Trading tips
To open long positions, one can rely on the rebound from the support level of 0.6819, with the subsequent breakout of 0.6833. Take profit – 0.6864 or 0.6881. Stop loss – 0.6810 or 0.6800.
A breakdown of 0.6819 may be a signal for new sales with target at 0.6782 or 0.6768. Stop loss – 0.6846.
Implementation time: 2-3 days.


No comments:
Write comments