EUR/USD: the euro is declining
09 December 2019, 12:05
| Scenario | |
|---|---|
| Timeframe | Intraday |
| Recommendation | BUY STOP |
| Entry Point | 1.1068 |
| Take Profit | 1.1100, 1.1115 |
| Stop Loss | 1.1038 |
| Key Levels | 1.0980, 1.1000, 1.1024, 1.1038, 1.1062, 1.1080, 1.1095, 1.1115 |
| Alternative scenario | |
|---|---|
| Recommendation | SELL STOP |
| Entry Point | 1.1035, 1.1020 |
| Take Profit | 1.1000, 1.0980 |
| Stop Loss | 1.1062 |
| Key Levels | 1.0980, 1.1000, 1.1024, 1.1038, 1.1062, 1.1080, 1.1095, 1.1115 |
Current trend
EUR is stable (–0.03%) against USD on Monday, consolidating after a sharp decline last Friday. EUR showed an active decline on Friday, retreating from its local highs and the level of 1.1115, after the publication of a strong report on the US labor market, which in many respects exceeded expectations. In November, the US economy created 266K new jobs with a forecast of growth of only 180K. Last month, the growth rate was 156K (revised upwards from the previous 128K). Average Hourly Earnings increased by 3.1% YoY, which is slightly worse than previous data of 3.2% YoY (revised from +3% YoY). November Unemployment Rate unexpectedly dropped from 3.6% to 3.5%. During the day, investors expect publication of statistics on Imports and Exports from Germany for October.
Support and resistance
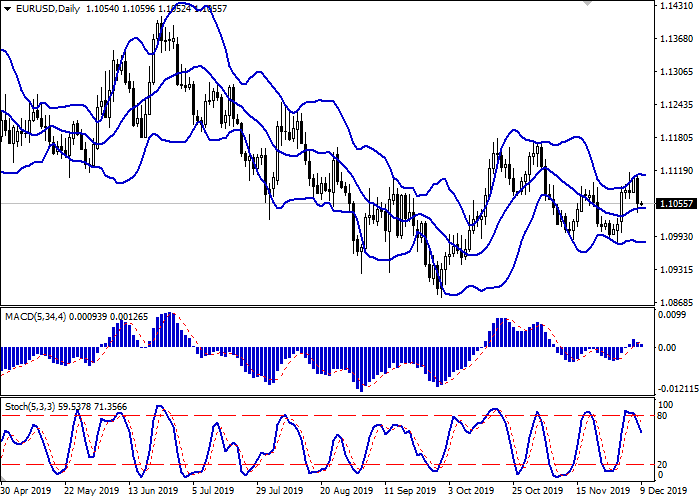
In the D1 chart, Bollinger Bands are reversing horizontally. The price range is narrowing from above, reflecting the emergence of ambiguous dynamics in the short term. MACD reversed downwards having formed a sell signal (located below the signal line). The indicator is about to test the zero line for a breakdown. Stochastic maintains a relatively confident downtrend, which signals in favor of the development of corrective decline in the ultra-short term.
Technical indicators do not contradict the further development of the downtrend in the short and/or ultra-short term.
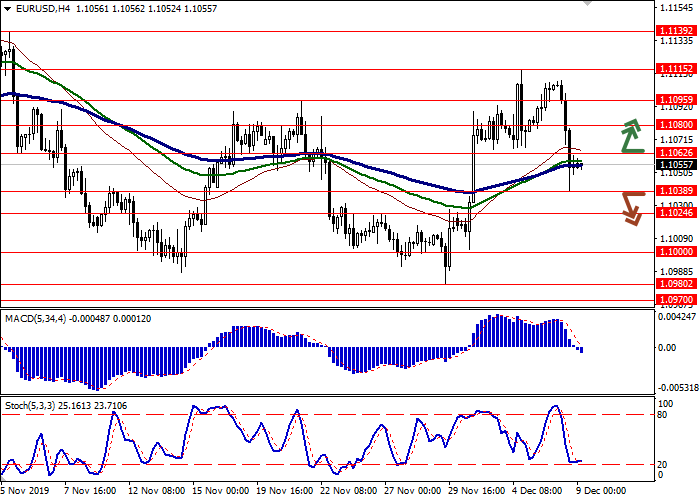
Resistance levels: 1.1062, 1.1080, 1.1095, 1.1115.
Support levels: 1.1038, 1.1024, 1.1000, 1.0980.


Trading tips
To open long positions, one can rely on the breakout of 1.1062. Take profit – 1.1100 or 1.1115. Stop loss – 1.1038.
A breakdown of 1.1038 or 1.1024 may be a signal for new sales with target at 1.1000 or 1.0980. Stop loss – 1.1062.
Implementation time: 2-3 days.
EUR is stable (–0.03%) against USD on Monday, consolidating after a sharp decline last Friday. EUR showed an active decline on Friday, retreating from its local highs and the level of 1.1115, after the publication of a strong report on the US labor market, which in many respects exceeded expectations. In November, the US economy created 266K new jobs with a forecast of growth of only 180K. Last month, the growth rate was 156K (revised upwards from the previous 128K). Average Hourly Earnings increased by 3.1% YoY, which is slightly worse than previous data of 3.2% YoY (revised from +3% YoY). November Unemployment Rate unexpectedly dropped from 3.6% to 3.5%. During the day, investors expect publication of statistics on Imports and Exports from Germany for October.
Support and resistance
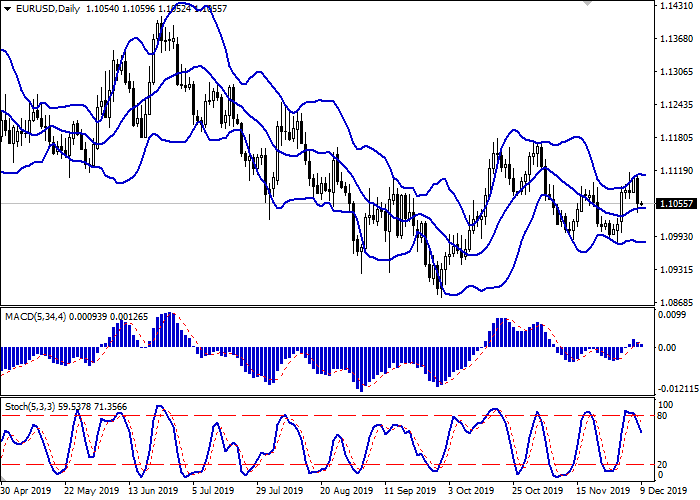
In the D1 chart, Bollinger Bands are reversing horizontally. The price range is narrowing from above, reflecting the emergence of ambiguous dynamics in the short term. MACD reversed downwards having formed a sell signal (located below the signal line). The indicator is about to test the zero line for a breakdown. Stochastic maintains a relatively confident downtrend, which signals in favor of the development of corrective decline in the ultra-short term.
Technical indicators do not contradict the further development of the downtrend in the short and/or ultra-short term.
Resistance levels: 1.1062, 1.1080, 1.1095, 1.1115.
Support levels: 1.1038, 1.1024, 1.1000, 1.0980.


Trading tips
To open long positions, one can rely on the breakout of 1.1062. Take profit – 1.1100 or 1.1115. Stop loss – 1.1038.
A breakdown of 1.1038 or 1.1024 may be a signal for new sales with target at 1.1000 or 1.0980. Stop loss – 1.1062.
Implementation time: 2-3 days.


No comments:
Write comments