XAG/USD: silver prices are in correction
02 August 2019, 09:59
| Scenario | |
|---|---|
| Timeframe | Intraday |
| Recommendation | BUY STOP |
| Entry Point | 16.32, 16.43 |
| Take Profit | 16.82, 17.00 |
| Stop Loss | 16.17, 16.10 |
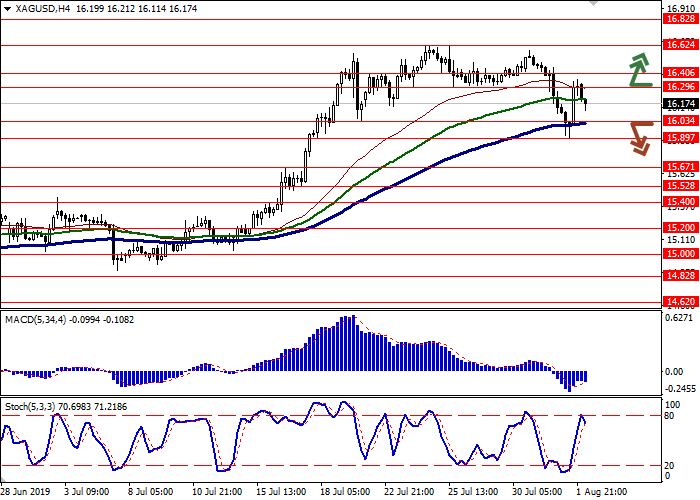
| Key Levels | 15.52, 15.67, 15.89, 16.03, 16.29, 16.40, 16.62, 16.82 |
| Alternative scenario | |
|---|---|
| Recommendation | SELL STOP |
| Entry Point | 16.00, 15.87 |
| Take Profit | 15.52, 15.40 |
| Stop Loss | 16.20 |
| Key Levels | 15.52, 15.67, 15.89, 16.03, 16.29, 16.40, 16.62, 16.82 |
Current trend
Yesterday, silver prices rose, although during the day the instrument renewed the lows since July 17. The instrument is under pressure of the results of the US Federal Reserve meeting on Wednesday, following which the regulator made the expected decision to decrease the interest rate by 25 basis points. At the same time, Fed Chairman Jerome Powell noted that the regulator was not considering the possibility of conducting a whole cycle of rate cuts but simply corrected the monetary policy parameters, adjusting it to changing external factors. Such statements significantly reduced the likelihood of a new reduction in the US Federal Reserve rate by the end of the current calendar year, as many experts expected.
Support and resistance
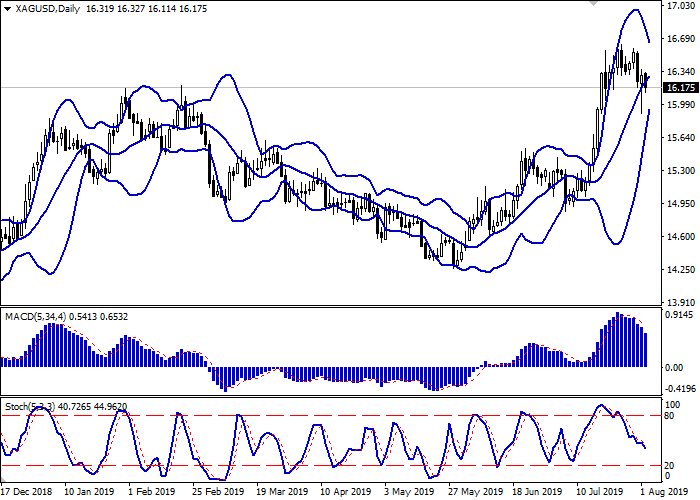
On the daily chart, Bollinger bands are growing steadily. The price range narrows, reflecting the emergence of ambiguous trading dynamics in the short term. The MACD indicator goes downwards, keeping a strong sell signal (the histogram is below the signal line). Stochastic is falling, keeping a fairly confident “bearish” momentum, which indicates the prospects for the further development of the downward trend in the short term.
It is better to keep the current short positions until the situation becomes clear.
Resistance levels: 16.29, 16.40, 16.62, 16.82.
Support levels: 16.03, 15.89, 15.67, 15.52.


Trading tips
Long positions can be opened after the breakout of the level of 16.29 or 16.40 with the target at 16.82 or 17.00. Stop loss – 16.17–16.10.
Short positions can be opened after the breakdown of the level of 16.03 or 15.89 with the target at 15.52 or 15.40. Stop loss – 16.10–16.20.
Implementation period: 2–3 days.
Yesterday, silver prices rose, although during the day the instrument renewed the lows since July 17. The instrument is under pressure of the results of the US Federal Reserve meeting on Wednesday, following which the regulator made the expected decision to decrease the interest rate by 25 basis points. At the same time, Fed Chairman Jerome Powell noted that the regulator was not considering the possibility of conducting a whole cycle of rate cuts but simply corrected the monetary policy parameters, adjusting it to changing external factors. Such statements significantly reduced the likelihood of a new reduction in the US Federal Reserve rate by the end of the current calendar year, as many experts expected.
Support and resistance
On the daily chart, Bollinger bands are growing steadily. The price range narrows, reflecting the emergence of ambiguous trading dynamics in the short term. The MACD indicator goes downwards, keeping a strong sell signal (the histogram is below the signal line). Stochastic is falling, keeping a fairly confident “bearish” momentum, which indicates the prospects for the further development of the downward trend in the short term.
It is better to keep the current short positions until the situation becomes clear.
Resistance levels: 16.29, 16.40, 16.62, 16.82.
Support levels: 16.03, 15.89, 15.67, 15.52.


Trading tips
Long positions can be opened after the breakout of the level of 16.29 or 16.40 with the target at 16.82 or 17.00. Stop loss – 16.17–16.10.
Short positions can be opened after the breakdown of the level of 16.03 or 15.89 with the target at 15.52 or 15.40. Stop loss – 16.10–16.20.
Implementation period: 2–3 days.


No comments:
Write comments