NZD/USD: New Zealand dollar declines
07 August 2019, 10:27
| Scenario | |
|---|---|
| Timeframe | Intraday |
| Recommendation | BUY STOP |
| Entry Point | 0.6430 |
| Take Profit | 0.6532, 0.6566 |
| Stop Loss | 0.6360 |
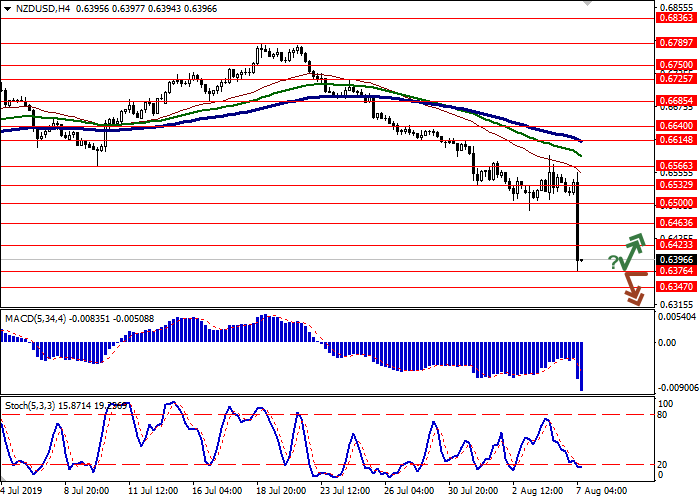
| Key Levels | 0.6300, 0.6347, 0.6376, 0.6423, 0.6463, 0.6500, 0.6532 |
| Alternative scenario | |
|---|---|
| Recommendation | SELL STOP |
| Entry Point | 0.6370 |
| Take Profit | 0.6300 |
| Stop Loss | 0.6420 |
| Key Levels | 0.6300, 0.6347, 0.6376, 0.6423, 0.6463, 0.6500, 0.6532 |
Current trend
Today, during the Asian session, the NZD/USD pair is steadily declining, renewing record lows since January 2016. Investors are focused on the RBNZ interest rate decision. Contrary to market expectations, the Central Bank of New Zealand decided to cut the rate by 50 basis points instead of 25. In the accompanying statement, commenting on the decision, the regulator referred to a slowdown in the economy over the past year and inflation consolidation below the target level of 2%. In addition, the Central Bank mentioned the growth of risks in the global economy, noting the general tendency to reduce rates by leading regulators.
On Wednesday, the macroeconomic background remains neutral, so the drivers in the market will be the same. Investors may be interested in data on the dynamics of China's foreign exchange reserves, as well as statistics on mortgage and consumer lending in the United States.
Support and resistance
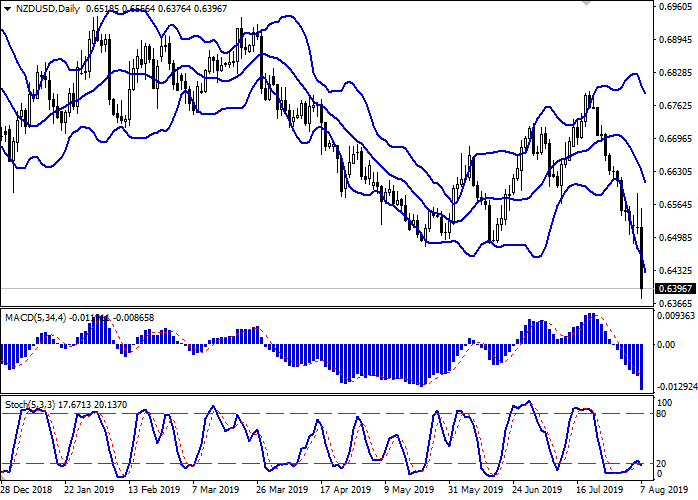
On the daily chart, Bollinger bands steadily fall. The price range actively expands but not as fast as the "bearish" moods develops. The MACD falls, keeping a sell signal (the histogram is below the signal line). Stochastic returns to the downward plane after an unsuccessful growth attempt. The indicator is still near its lows, indicating that NZD may become oversold in the ultra-short term.
It is better to wait until the situation is clear.
Resistance levels: 0.6423, 0.6463, 0.6500, 0.6532.
Support levels: 0.6376, 0.6347, 0.6300.


Trading tips
Long positions can be opened after a rebound from 0.6376 and a breakout of 0.6423 with the target at 0.6532 or 0.6566. Stop loss is 0.6360. Implementation period: 2–3 days.
Short positions can be opened after the breakdown of 0.6376 with the target at 0.6300. Stop loss is 0.6420. Implementation period: 1–2 days.
Today, during the Asian session, the NZD/USD pair is steadily declining, renewing record lows since January 2016. Investors are focused on the RBNZ interest rate decision. Contrary to market expectations, the Central Bank of New Zealand decided to cut the rate by 50 basis points instead of 25. In the accompanying statement, commenting on the decision, the regulator referred to a slowdown in the economy over the past year and inflation consolidation below the target level of 2%. In addition, the Central Bank mentioned the growth of risks in the global economy, noting the general tendency to reduce rates by leading regulators.
On Wednesday, the macroeconomic background remains neutral, so the drivers in the market will be the same. Investors may be interested in data on the dynamics of China's foreign exchange reserves, as well as statistics on mortgage and consumer lending in the United States.
Support and resistance
On the daily chart, Bollinger bands steadily fall. The price range actively expands but not as fast as the "bearish" moods develops. The MACD falls, keeping a sell signal (the histogram is below the signal line). Stochastic returns to the downward plane after an unsuccessful growth attempt. The indicator is still near its lows, indicating that NZD may become oversold in the ultra-short term.
It is better to wait until the situation is clear.
Resistance levels: 0.6423, 0.6463, 0.6500, 0.6532.
Support levels: 0.6376, 0.6347, 0.6300.


Trading tips
Long positions can be opened after a rebound from 0.6376 and a breakout of 0.6423 with the target at 0.6532 or 0.6566. Stop loss is 0.6360. Implementation period: 2–3 days.
Short positions can be opened after the breakdown of 0.6376 with the target at 0.6300. Stop loss is 0.6420. Implementation period: 1–2 days.


No comments:
Write comments