EUR/USD: the euro is strengthening
07 August 2019, 10:25
| Scenario | |
|---|---|
| Timeframe | Intraday |
| Recommendation | BUY STOP |
| Entry Point | 1.1250 |
| Take Profit | 1.1316 |
| Stop Loss | 1.1220 |
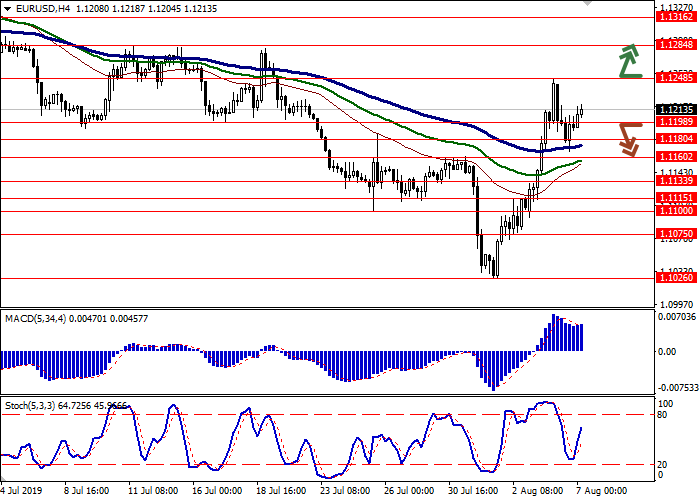
| Key Levels | 1.1133, 1.1160, 1.1180, 1.1198, 1.1248, 1.1284, 1.1316 |
| Alternative scenario | |
|---|---|
| Recommendation | SELL STOP |
| Entry Point | 1.1190, 1.1175 |
| Take Profit | 1.1115, 1.1100 |
| Stop Loss | 1.1220, 1.1240 |
| Key Levels | 1.1133, 1.1160, 1.1180, 1.1198, 1.1248, 1.1284, 1.1316 |
Current trend
EUR showed ambiguous trading against USD yesterday. It maintained an upward trend only at the opening of the afternoon session and increased slightly at the beginning of the American session. The reduction in the pair was due to technical factors, as the news background was almost unchanged. Investors are discussing the aggravation of the US-China trade conflict, which flows into a currency war. CNY fell against USD to its lowest level since 2008, which will weaken the negative effect of Washington's new import duties introduction. The market also expects a possible reduction in the interest rate by the Fed in September.
Tuesday’s macroeconomic statistics from Germany did not support EUR. Factory Orders in June increased significantly by 2.5% MoM after the decline by 2.0% MoM in the previous month, with the forecast of +0.5% MoM. In annual terms, the indicator decreased by 3.6% YoY, which is much better than –8.4% YoY last month.
Support and resistance
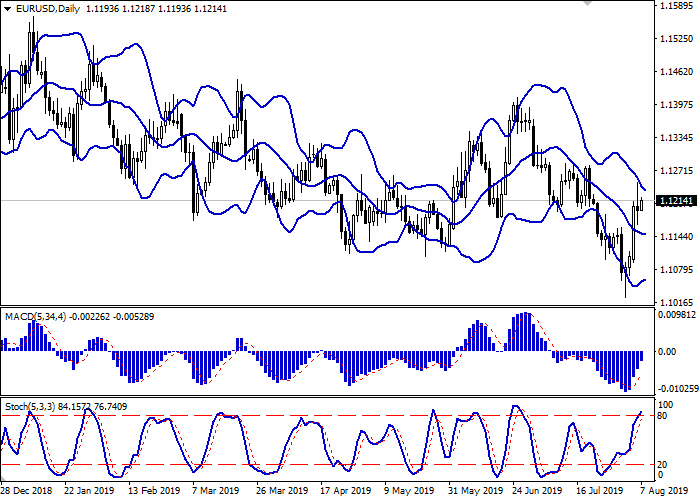
In the D1 chart, Bollinger Bands are reversing horizontally. The price range is narrowing, reflecting a sharp change of trend in the short term. MACD indicator is growing, keeping a stable buy signal (located above the signal line). Stochastic keeps the uptrend, but approaches its highs, which indicates the risks of overbought EUR in the ultra-short term.
Technical indicators do not contradict further development of the uptrend in the short and/or ultra-short term.
Resistance levels: 1.1248, 1.1284, 1.1316.
Support levels: 1.1198, 1.1180, 1.1160, 1.1133.


Trading tips
To open long positions, one can rely on the breakout of 1.1248. Take profit — 1.1316. Stop loss — 1.1220. Implementation time: 1-2 days.
A breakdown of 1.1198 or 1.1180 may be a signal to further sales with target at 1.1115 or 1.1100. Stop loss — 1.1220–1.1240. Implementation time: 2-3 days.
EUR showed ambiguous trading against USD yesterday. It maintained an upward trend only at the opening of the afternoon session and increased slightly at the beginning of the American session. The reduction in the pair was due to technical factors, as the news background was almost unchanged. Investors are discussing the aggravation of the US-China trade conflict, which flows into a currency war. CNY fell against USD to its lowest level since 2008, which will weaken the negative effect of Washington's new import duties introduction. The market also expects a possible reduction in the interest rate by the Fed in September.
Tuesday’s macroeconomic statistics from Germany did not support EUR. Factory Orders in June increased significantly by 2.5% MoM after the decline by 2.0% MoM in the previous month, with the forecast of +0.5% MoM. In annual terms, the indicator decreased by 3.6% YoY, which is much better than –8.4% YoY last month.
Support and resistance
In the D1 chart, Bollinger Bands are reversing horizontally. The price range is narrowing, reflecting a sharp change of trend in the short term. MACD indicator is growing, keeping a stable buy signal (located above the signal line). Stochastic keeps the uptrend, but approaches its highs, which indicates the risks of overbought EUR in the ultra-short term.
Technical indicators do not contradict further development of the uptrend in the short and/or ultra-short term.
Resistance levels: 1.1248, 1.1284, 1.1316.
Support levels: 1.1198, 1.1180, 1.1160, 1.1133.


Trading tips
To open long positions, one can rely on the breakout of 1.1248. Take profit — 1.1316. Stop loss — 1.1220. Implementation time: 1-2 days.
A breakdown of 1.1198 or 1.1180 may be a signal to further sales with target at 1.1115 or 1.1100. Stop loss — 1.1220–1.1240. Implementation time: 2-3 days.


No comments:
Write comments