XAU/USD: gold prices are rising
07 August 2019, 10:29
| Scenario | |
|---|---|
| Timeframe | Intraday |
| Recommendation | BUY STOP |
| Entry Point | 1489.95 |
| Take Profit | 1520.00 |
| Stop Loss | 1474.61 |
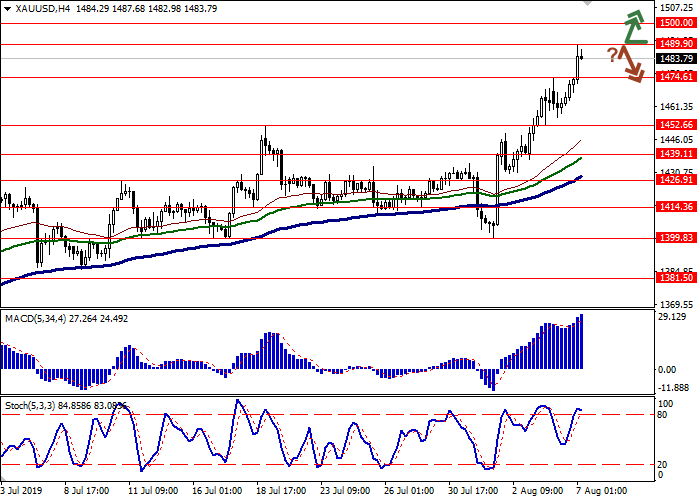
| Key Levels | 1426.91, 1439.11, 1452.66, 1474.61, 1489.90, 1500.00, 1520.00 |
| Alternative scenario | |
|---|---|
| Recommendation | SELL STOP |
| Entry Point | 1474.55 |
| Take Profit | 1452.66, 1439.11 |
| Stop Loss | 1489.90 |
| Key Levels | 1426.91, 1439.11, 1452.66, 1474.61, 1489.90, 1500.00, 1520.00 |
Current trend
Gold prices showed moderate growth on Tuesday and continue to maintain a steady upward trend during today's Asian session. The growth of the instrument is facilitated by a new round of aggravation of trade relations between the USA and China. Donald Trump threatened to introduce 10% import duties on Chinese goods in the amount of 300 billion dollars. Beijing promised to respond with symmetrical measures and has now “let go” of the yuan rate, which has reached its lowest levels since 2008. Such a significant depreciation of CNY will help China reduce the negative effect of new import duties. In addition, the market expects the Fed to respond to this step by the Chinese authorities with another reduction in interest rates during its September meeting.
Support and resistance
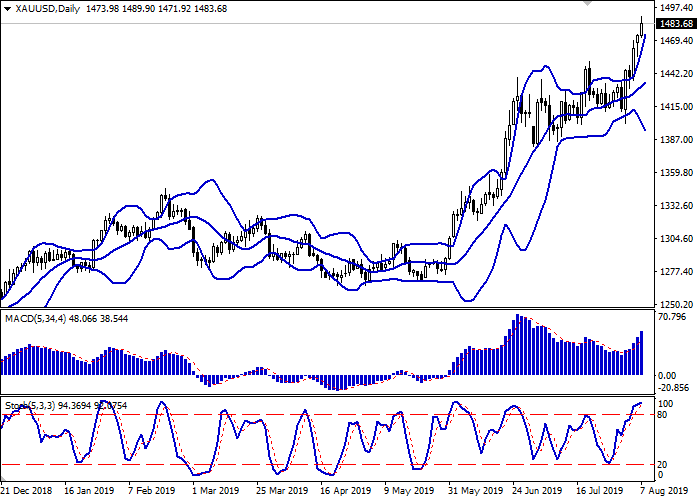
Bollinger Bands in D1 chart show moderate growth. The price range is widening but does not conform to the development of the “bullish” trend yet. MACD indicator is growing preserving a moderate buy signal (located above the signal line). Stochastic is approaching its highs and reversing into the horizontal plane, indicating strongly overbought gold in the ultra-short term.
Existing long positions should be kept until the situation clears up.
Resistance levels: 1489.90, 1500.00, 1520.00.
Support levels: 1474.61, 1452.66, 1439.11, 1426.91.


Trading tips
To open long positions, one can rely on the breakout of 1489.90. Take profit — 1520.00. Stop loss — 1474.61. Implementation time: 1-2 days.
The rebound from 1489.90 as from resistance with the subsequent breakdown of 1474.61 can become a signal to new sales with target at 1452.66 or 1439.11. Stop loss — 1489.90. Implementation time: 2-3 days.
Gold prices showed moderate growth on Tuesday and continue to maintain a steady upward trend during today's Asian session. The growth of the instrument is facilitated by a new round of aggravation of trade relations between the USA and China. Donald Trump threatened to introduce 10% import duties on Chinese goods in the amount of 300 billion dollars. Beijing promised to respond with symmetrical measures and has now “let go” of the yuan rate, which has reached its lowest levels since 2008. Such a significant depreciation of CNY will help China reduce the negative effect of new import duties. In addition, the market expects the Fed to respond to this step by the Chinese authorities with another reduction in interest rates during its September meeting.
Support and resistance
Bollinger Bands in D1 chart show moderate growth. The price range is widening but does not conform to the development of the “bullish” trend yet. MACD indicator is growing preserving a moderate buy signal (located above the signal line). Stochastic is approaching its highs and reversing into the horizontal plane, indicating strongly overbought gold in the ultra-short term.
Existing long positions should be kept until the situation clears up.
Resistance levels: 1489.90, 1500.00, 1520.00.
Support levels: 1474.61, 1452.66, 1439.11, 1426.91.


Trading tips
To open long positions, one can rely on the breakout of 1489.90. Take profit — 1520.00. Stop loss — 1474.61. Implementation time: 1-2 days.
The rebound from 1489.90 as from resistance with the subsequent breakdown of 1474.61 can become a signal to new sales with target at 1452.66 or 1439.11. Stop loss — 1489.90. Implementation time: 2-3 days.


No comments:
Write comments