Brent Crude Oil: oil prices remain under pressure
06 August 2019, 09:46
| Scenario | |
|---|---|
| Timeframe | Intraday |
| Recommendation | BUY STOP |
| Entry Point | 60.70, 61.55 |
| Take Profit | 64.00 |
| Stop Loss | 60.00, 59.30 |
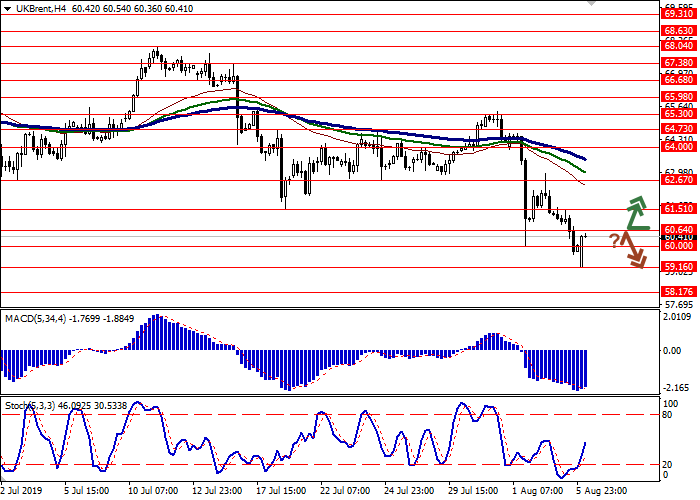
| Key Levels | 58.17, 59.16, 60.00, 60.64, 61.51, 62.67, 64.00 |
| Alternative scenario | |
|---|---|
| Recommendation | SELL STOP |
| Entry Point | 59.95 |
| Take Profit | 58.17, 58.00 |
| Stop Loss | 61.00 |
| Key Levels | 58.17, 59.16, 60.00, 60.64, 61.51, 62.67, 64.00 |
Current trend
On Monday, oil prices fell, reacting to the aggravation of the US-China trade conflict: on Friday, Donald Trump threatened to introduce 10% duty on the remaining Chinese imports in the amount of $300 billion from September, 1. The PRC said that in this case it would go for retaliatory measures but for now, Beijing is actively depreciating the national currency in order to mitigate the potential damage from new restrictions. In addition to the risks of a slowdown in the global economy and a decrease in oil demand, an aggravation of the conflict could threaten the resumption of imports of Iranian “black gold” from China, bypassing US sanctions.
Today, investors are awaiting the publication of an API report on oil reserves for the week of August 2. The previous report reflected a decrease in reserves of 6.024 million barrels.
Support and resistance
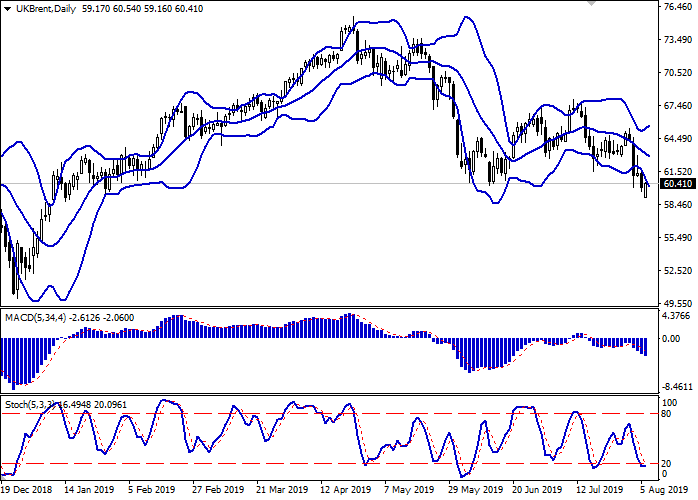
On the daily chart, Bollinger Bands actively decline. The price range expands but not as fast as the “bearish” moods develop. The MACD falls, keeping a moderate sell signal (the histogram is below the signal line). Stochastic, approaching its lows, tends to reverse into the horizontal plane, reflecting the risks that the instrument is oversold in the ultra-short term.
It is better to wait until the situation is clear to open new positions in the market.
Resistance levels: 60.64, 61.51, 62.67, 64.00.
Support levels: 60.00, 59.16, 58.17.


Trading tips
Long positions can be opened after the breakout of 60.64 or 61.51 with the target at 64.00. Stop loss is 60.00 or 59.30. Implementation period: 2–3 days.
Short positions can be opened after a rebound from 60.64 and a breakdown of 60.00 with the targets at 58.17–58.00. Stop loss is 61.00. Implementation period: 1–2 days.
On Monday, oil prices fell, reacting to the aggravation of the US-China trade conflict: on Friday, Donald Trump threatened to introduce 10% duty on the remaining Chinese imports in the amount of $300 billion from September, 1. The PRC said that in this case it would go for retaliatory measures but for now, Beijing is actively depreciating the national currency in order to mitigate the potential damage from new restrictions. In addition to the risks of a slowdown in the global economy and a decrease in oil demand, an aggravation of the conflict could threaten the resumption of imports of Iranian “black gold” from China, bypassing US sanctions.
Today, investors are awaiting the publication of an API report on oil reserves for the week of August 2. The previous report reflected a decrease in reserves of 6.024 million barrels.
Support and resistance
On the daily chart, Bollinger Bands actively decline. The price range expands but not as fast as the “bearish” moods develop. The MACD falls, keeping a moderate sell signal (the histogram is below the signal line). Stochastic, approaching its lows, tends to reverse into the horizontal plane, reflecting the risks that the instrument is oversold in the ultra-short term.
It is better to wait until the situation is clear to open new positions in the market.
Resistance levels: 60.64, 61.51, 62.67, 64.00.
Support levels: 60.00, 59.16, 58.17.


Trading tips
Long positions can be opened after the breakout of 60.64 or 61.51 with the target at 64.00. Stop loss is 60.00 or 59.30. Implementation period: 2–3 days.
Short positions can be opened after a rebound from 60.64 and a breakdown of 60.00 with the targets at 58.17–58.00. Stop loss is 61.00. Implementation period: 1–2 days.


No comments:
Write comments