AUD/USD: the instrument is correcting
06 August 2019, 09:57
| Scenario | |
|---|---|
| Timeframe | Intraday |
| Recommendation | BUY STOP |
| Entry Point | 0.6805 |
| Take Profit | 0.6900 |
| Stop Loss | 0.6760 |
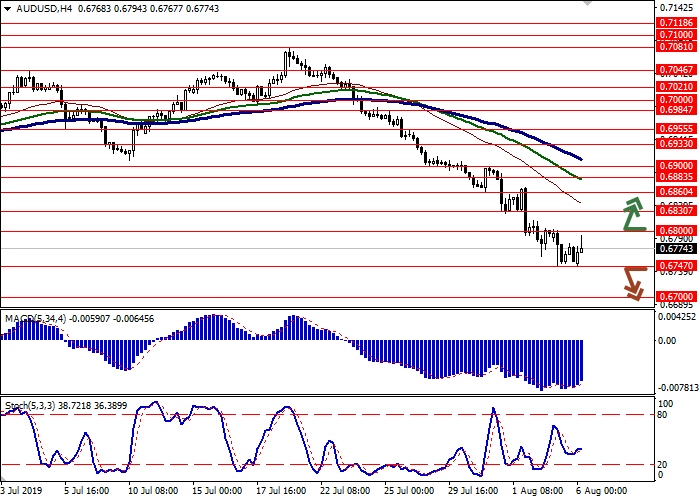
| Key Levels | 0.6650, 0.6700, 0.6747, 0.6800, 0.6830, 0.6860, 0.6883 |
| Alternative scenario | |
|---|---|
| Recommendation | SELL STOP |
| Entry Point | 0.6740 |
| Take Profit | 0.6650 |
| Stop Loss | 0.6800 |
| Key Levels | 0.6650, 0.6700, 0.6747, 0.6800, 0.6830, 0.6860, 0.6883 |
Current trend
AUD closed Monday with a steady decline against USD, reacting to another aggravation of trade relations between the US and China, which threatens to further slow the global economy down. The development of the "bearish" dynamics in the instrument was also facilitated by macroeconomic statistics. AiG Services Index in Australia went down from 52.2 to 43.9 points in June. Chinese Caixin Services PMI for the same period retreated from 52.0 to 51.6 points with a forecast of 51.9 points.
During today's Asian session, the pair is trading with an increase. The focus of investors is on the RBA decision on the interest rate. As expected, the Australian regulator kept the interest rate unchanged at 1%, maintaining the same rhetoric. The RBA expects moderate growth in Australia's economy at 2.50–2.75% in 2019 and 2020. According to the regulator, inflation will return to the target level of 2% by 2020.
Support and resistance
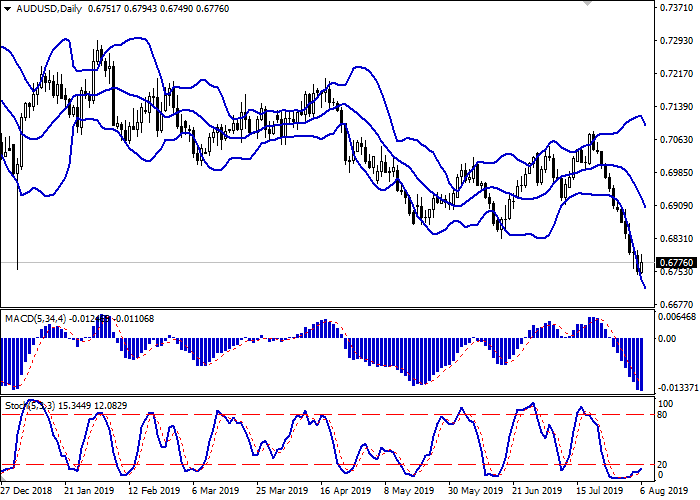
Bollinger Bands in D1 chart demonstrate a stable decrease. The price range is slightly narrowing from above, being spacious enough for the current activity level in the market. MACD is going down preserving a stable sell signal (located below the signal line). Stochastic retreats from its lows gradually, indicating the corrective growth development in the short and/or ultra-short term.
The development of uptrend is possible in the near future.
Resistance levels: 0.6800, 0.6830, 0.6860, 0.6883.
Support levels: 0.6747, 0.6700, 0.6650.


Trading tips
To open long positions, one can rely on the breakout of 0.6800. Take profit — 0.6900. Stop loss — 0.6760.
The breakdown of 0.6747 may serve as a signal to new sales with the target at 0.6650. Stop loss should be placed not further than 0.6800.
Implementation time: 2-3 days.
AUD closed Monday with a steady decline against USD, reacting to another aggravation of trade relations between the US and China, which threatens to further slow the global economy down. The development of the "bearish" dynamics in the instrument was also facilitated by macroeconomic statistics. AiG Services Index in Australia went down from 52.2 to 43.9 points in June. Chinese Caixin Services PMI for the same period retreated from 52.0 to 51.6 points with a forecast of 51.9 points.
During today's Asian session, the pair is trading with an increase. The focus of investors is on the RBA decision on the interest rate. As expected, the Australian regulator kept the interest rate unchanged at 1%, maintaining the same rhetoric. The RBA expects moderate growth in Australia's economy at 2.50–2.75% in 2019 and 2020. According to the regulator, inflation will return to the target level of 2% by 2020.
Support and resistance
Bollinger Bands in D1 chart demonstrate a stable decrease. The price range is slightly narrowing from above, being spacious enough for the current activity level in the market. MACD is going down preserving a stable sell signal (located below the signal line). Stochastic retreats from its lows gradually, indicating the corrective growth development in the short and/or ultra-short term.
The development of uptrend is possible in the near future.
Resistance levels: 0.6800, 0.6830, 0.6860, 0.6883.
Support levels: 0.6747, 0.6700, 0.6650.


Trading tips
To open long positions, one can rely on the breakout of 0.6800. Take profit — 0.6900. Stop loss — 0.6760.
The breakdown of 0.6747 may serve as a signal to new sales with the target at 0.6650. Stop loss should be placed not further than 0.6800.
Implementation time: 2-3 days.


No comments:
Write comments