NZD/USD: general analysis
06 August 2019, 14:24
| Scenario | |
|---|---|
| Timeframe | Intraday |
| Recommendation | SELL STOP |
| Entry Point | 0.6520 |
| Take Profit | 0.6470, 0.6408, 0.6347 |
| Stop Loss | 0.6550 |
| Key Levels | 0.6714, 0.6652, 0.6590, 0.6470, 0.6408, 0.6347 |
| Alternative scenario | |
|---|---|
| Recommendation | BUY STOP |
| Entry Point | 0.6595 |
| Take Profit | 0.6652, 0.6714 |
| Stop Loss | 0.6560 |
| Key Levels | 0.6714, 0.6652, 0.6590, 0.6470, 0.6408, 0.6347 |
Current trend
Today, the NZD/USD pair was corrected to the area of 0.6585 due to strong New Zealand labor market data. The Q2 unemployment rate decreased from 4.2% to 3.9%, which is the lowest level since 2008. Employment increased by 0.8% (instead of the expected 0.2%), while the average hourly wage remained at 1.1% (instead of the expected slowdown to 0.5%). The strengthening is unlikely to be serious since the fundamental picture remains negative. The US-China conflict escalation put pressure on global demand. In New Zealand, production activity remains low, and inflation did not reach the target level of 2.0% in two years, and the quarterly RBNZ poll recorded a decrease in forecasts for 2019 inflation growth from 1.97% to 1.71%.
Tomorrow, the RBNZ may reduce the interest rates from 1.50% to 1.25%, affecting NZD negatively. Most likely, the decrease will continue in September and November, and by the end of the year, the value will reach 0.75%. However, recent labor market data make monetary easing less aggressive.
Support and resistance
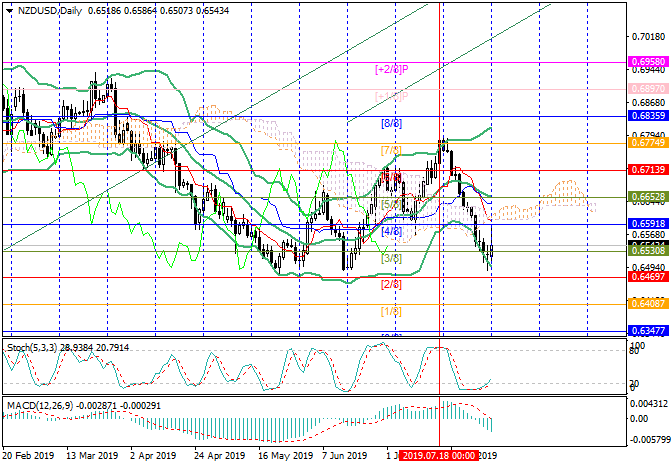
The price is around 0.6550 and may decline to 0.6470 (Murrey [2/8]), 0.6408 (Murrey [1/8]) and 0.6347 (Murrey [0/8]). An increase to the levels of 0.6652 (Murrey [5/8]) and 0.6714 (Murrey [6/8]) is possible after the breakdown of the central level of Murrey around 0.6590 (Murrey [4/8]).
Technical indicators do not give a clear signal. Bollinger Bands reverse downwards, the MACD grows in the negative zone but Stochastic leaves the oversold zone.
Resistance levels: 0.6470, 0.6408, 0.6347.
Support levels: 0.6590, 0.6652, 0.6714.

Trading tips
Short positions can be opened from 0.6520 with the targets at 0.6470, 0.6408, 0.6347 and stop loss 0.6550.
Long positions can be opened after consolidation above 0.6590 with the targets at 0.6652, 0.6714 and stop loss 0.6560.
Implementation period: 3–4 days.
Today, the NZD/USD pair was corrected to the area of 0.6585 due to strong New Zealand labor market data. The Q2 unemployment rate decreased from 4.2% to 3.9%, which is the lowest level since 2008. Employment increased by 0.8% (instead of the expected 0.2%), while the average hourly wage remained at 1.1% (instead of the expected slowdown to 0.5%). The strengthening is unlikely to be serious since the fundamental picture remains negative. The US-China conflict escalation put pressure on global demand. In New Zealand, production activity remains low, and inflation did not reach the target level of 2.0% in two years, and the quarterly RBNZ poll recorded a decrease in forecasts for 2019 inflation growth from 1.97% to 1.71%.
Tomorrow, the RBNZ may reduce the interest rates from 1.50% to 1.25%, affecting NZD negatively. Most likely, the decrease will continue in September and November, and by the end of the year, the value will reach 0.75%. However, recent labor market data make monetary easing less aggressive.
Support and resistance
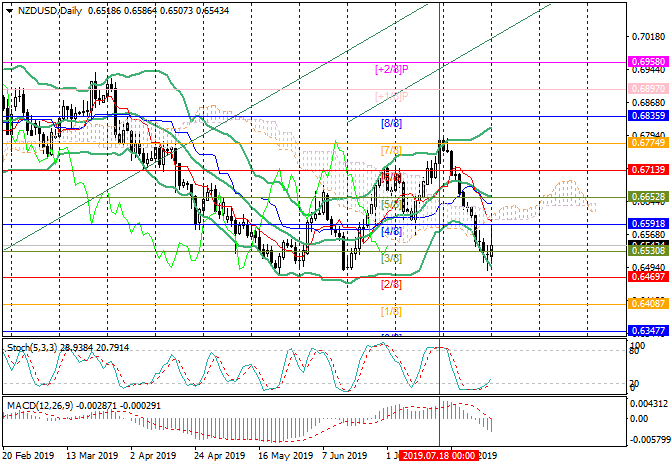
The price is around 0.6550 and may decline to 0.6470 (Murrey [2/8]), 0.6408 (Murrey [1/8]) and 0.6347 (Murrey [0/8]). An increase to the levels of 0.6652 (Murrey [5/8]) and 0.6714 (Murrey [6/8]) is possible after the breakdown of the central level of Murrey around 0.6590 (Murrey [4/8]).
Technical indicators do not give a clear signal. Bollinger Bands reverse downwards, the MACD grows in the negative zone but Stochastic leaves the oversold zone.
Resistance levels: 0.6470, 0.6408, 0.6347.
Support levels: 0.6590, 0.6652, 0.6714.

Trading tips
Short positions can be opened from 0.6520 with the targets at 0.6470, 0.6408, 0.6347 and stop loss 0.6550.
Long positions can be opened after consolidation above 0.6590 with the targets at 0.6652, 0.6714 and stop loss 0.6560.
Implementation period: 3–4 days.


No comments:
Write comments