XAU/USD: gold prices are falling
08 July 2019, 09:39
| Scenario | |
|---|---|
| Timeframe | Intraday |
| Recommendation | BUY STOP |
| Entry Point | 1411.60 |
| Take Profit | 1439.11, 1450.00 |
| Stop Loss | 1400.00 |
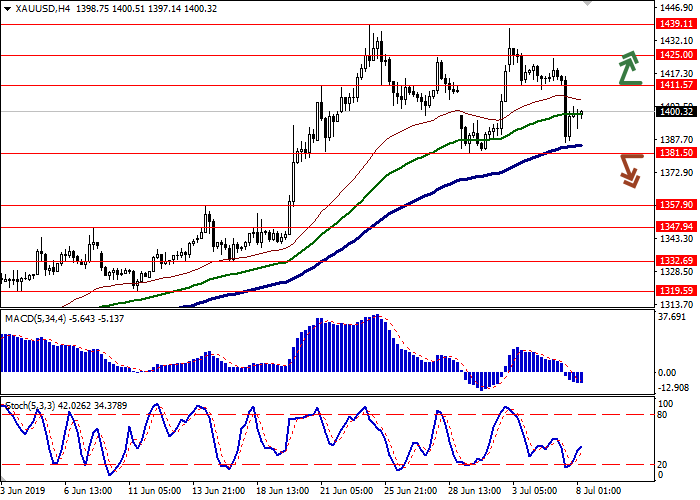
| Key Levels | 1332.69, 1347.94, 1357.90, 1381.50, 1411.57, 1425.00, 1439.11 |
| Alternative scenario | |
|---|---|
| Recommendation | SELL STOP |
| Entry Point | 1381.45 |
| Take Profit | 1357.90, 1347.94 |
| Stop Loss | 1390.00, 1400.00 |
| Key Levels | 1332.69, 1347.94, 1357.90, 1381.50, 1411.57, 1425.00, 1439.11 |
Current trend
On Friday, gold prices declined substantially, responding to the publication of an unexpectedly strong US employment report for June. The growth of Nonfarm Payrolls amounted to 224K, while investors relied on 160K. Such confident data reinforced doubts about the Fed's interest rate reduction during the July meeting, which previously provided strong support to gold. However, the report also reflected the growth of the unemployment rate and pointed to a slowdown in wage growth, so the regulator has enough reasons to ease monetary policy.
Today, during the Asian session, the instrument is under pressure due to the resumed trade negotiations between the US and China, which may well be crowned with the signing of the long-awaited agreement.
Support and resistance
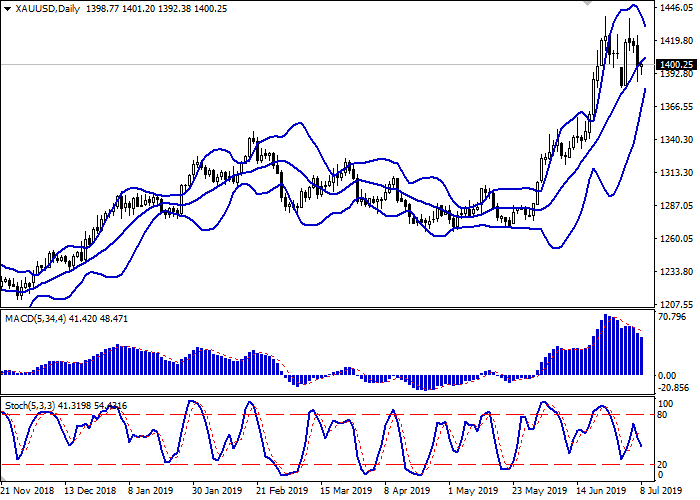
Bollinger bands are growing steadily on the daily chart. The price range is actively narrowing, reflecting the emergence of mixed trading dynamics in the short term. The MACD indicator is falling, keeping a relatively strong sell signal (the histogram is below the signal line). Stochastic maintains a confident downward direction but is not far from its lows, which limits the prospects for the development of a downward trend in the super-short term.
Resistance levels: 1411.57, 1425.00, 1439.11.
Support levels: 1381.50, 1357.90, 1347.94, 1332.69.


Trading tips
Long positions can be opened after the breakout of the level of 1411.57 with the target at 1439.11 or 1450.00. Stop loss is 1400.00.
Short positions can be opened after the breakdown of the level of 1381.50 with the target at 1357.90 or 1347.94. Stop loss is 1390.00 or 1400.00.
Implementation period: 2–3 days.
On Friday, gold prices declined substantially, responding to the publication of an unexpectedly strong US employment report for June. The growth of Nonfarm Payrolls amounted to 224K, while investors relied on 160K. Such confident data reinforced doubts about the Fed's interest rate reduction during the July meeting, which previously provided strong support to gold. However, the report also reflected the growth of the unemployment rate and pointed to a slowdown in wage growth, so the regulator has enough reasons to ease monetary policy.
Today, during the Asian session, the instrument is under pressure due to the resumed trade negotiations between the US and China, which may well be crowned with the signing of the long-awaited agreement.
Support and resistance
Bollinger bands are growing steadily on the daily chart. The price range is actively narrowing, reflecting the emergence of mixed trading dynamics in the short term. The MACD indicator is falling, keeping a relatively strong sell signal (the histogram is below the signal line). Stochastic maintains a confident downward direction but is not far from its lows, which limits the prospects for the development of a downward trend in the super-short term.
Resistance levels: 1411.57, 1425.00, 1439.11.
Support levels: 1381.50, 1357.90, 1347.94, 1332.69.


Trading tips
Long positions can be opened after the breakout of the level of 1411.57 with the target at 1439.11 or 1450.00. Stop loss is 1400.00.
Short positions can be opened after the breakdown of the level of 1381.50 with the target at 1357.90 or 1347.94. Stop loss is 1390.00 or 1400.00.
Implementation period: 2–3 days.


No comments:
Write comments