USD/JPY: USD is strengthening
08 July 2019, 09:35
| Scenario | |
|---|---|
| Timeframe | Intraday |
| Recommendation | BUY STOP |
| Entry Point | 108.60, 108.75 |
| Take Profit | 109.30 |
| Stop Loss | 108.30, 108.20 |
| Key Levels | 107.03, 107.52, 107.80, 108.14, 108.52, 108.79, 109.00, 109.30 |
| Alternative scenario | |
|---|---|
| Recommendation | SELL STOP |
| Entry Point | 108.10 |
| Take Profit | 107.52, 107.30, 107.20 |
| Stop Loss | 108.40, 108.50 |
| Key Levels | 107.03, 107.52, 107.80, 108.14, 108.52, 108.79, 109.00, 109.30 |
Current trend
USD rose against JPY on Friday, updating local highs of June 18. Confident support for the dollar was provided by data on the US labor market for June, which reflected a sharp increase in nonfarm payrolls by 224K (with a forecast of 160K). The report also indicated an increase in unemployment and a slowdown in the average hourly wage MoM in June. Published on Friday, macroeconomic statistics from Japan was ambiguous. The index of coincident indicators in May rose from 102.1 to 103.2 points, while the index of leading indicators decreased from 95.9 to 95.2 points.
Today, the pair is trading in both directions. The yen is pressured by mixed macroeconomic statistics from Japan. Bank lending slowed in June from 2.6% to 2.3% YoY, while the forecast was 2.8%. The demand for machine-building products in May fell by 7.8% MoM after a growth of 5.2% last month.
Support and resistance
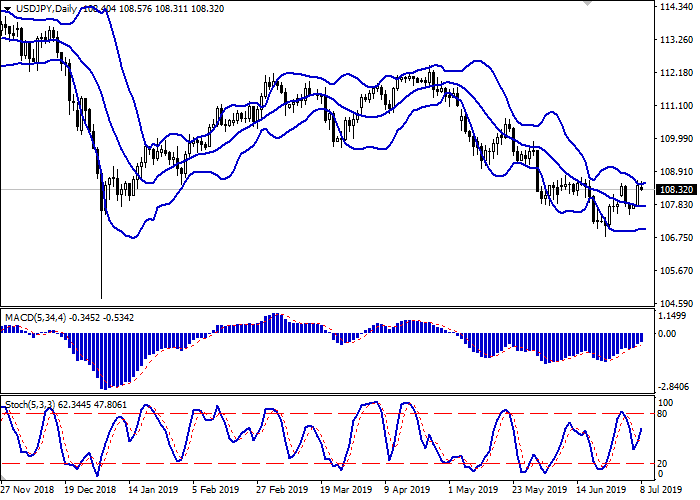
Bollinger Bands in the D1 chart demonstrate flat dynamics. The price range is expanding from above, however, failing to catch the development of "bullish" dynamics. MACD indicator is growing preserving a moderate buy signal (the histogram is above the signal line). Stochastic retains a stable upward direction but is rapidly approaching its maxima, indicating overbought instrument in the ultra-short term.
The current showings of the indicator do not contradict the further development of the uptrend in the nearest time.
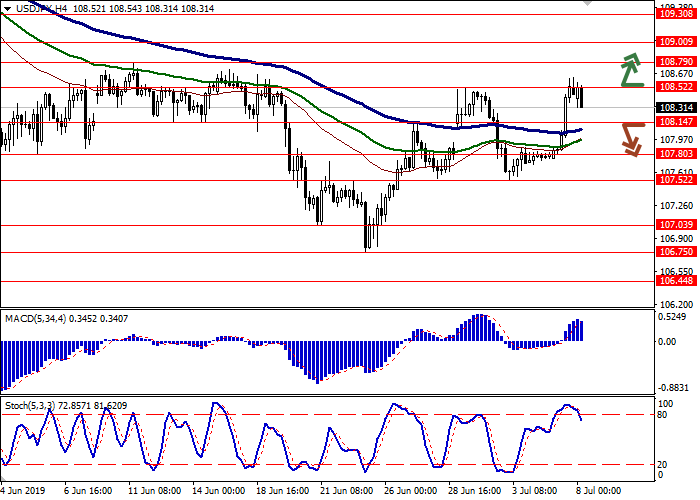
Resistance levels: 108.52, 108.79, 109.00, 109.30.
Support levels: 108.14, 107.80, 107.52, 107.03.


Trading tips
To open long positions, one can rely on the breakout of 108.52–108.70. Take-profit – 109.30. Stop loss – 108.30–108.20.
The return of "bearish" dynamics with the breakdown of 108.14 may become a signal for sales with the target at 107.52 or 107.30–107.20. Stop loss – 108.40–108.50.
Implementation period: 2-3 days.
USD rose against JPY on Friday, updating local highs of June 18. Confident support for the dollar was provided by data on the US labor market for June, which reflected a sharp increase in nonfarm payrolls by 224K (with a forecast of 160K). The report also indicated an increase in unemployment and a slowdown in the average hourly wage MoM in June. Published on Friday, macroeconomic statistics from Japan was ambiguous. The index of coincident indicators in May rose from 102.1 to 103.2 points, while the index of leading indicators decreased from 95.9 to 95.2 points.
Today, the pair is trading in both directions. The yen is pressured by mixed macroeconomic statistics from Japan. Bank lending slowed in June from 2.6% to 2.3% YoY, while the forecast was 2.8%. The demand for machine-building products in May fell by 7.8% MoM after a growth of 5.2% last month.
Support and resistance
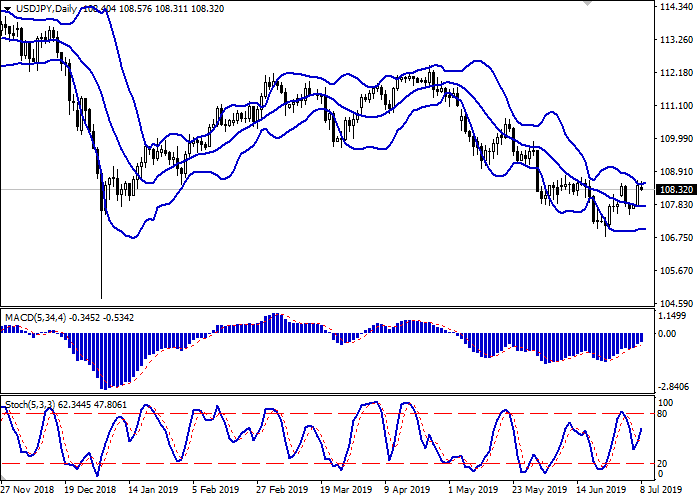
Bollinger Bands in the D1 chart demonstrate flat dynamics. The price range is expanding from above, however, failing to catch the development of "bullish" dynamics. MACD indicator is growing preserving a moderate buy signal (the histogram is above the signal line). Stochastic retains a stable upward direction but is rapidly approaching its maxima, indicating overbought instrument in the ultra-short term.
The current showings of the indicator do not contradict the further development of the uptrend in the nearest time.
Resistance levels: 108.52, 108.79, 109.00, 109.30.
Support levels: 108.14, 107.80, 107.52, 107.03.


Trading tips
To open long positions, one can rely on the breakout of 108.52–108.70. Take-profit – 109.30. Stop loss – 108.30–108.20.
The return of "bearish" dynamics with the breakdown of 108.14 may become a signal for sales with the target at 107.52 or 107.30–107.20. Stop loss – 108.40–108.50.
Implementation period: 2-3 days.


No comments:
Write comments