XAU/USD: gold prices are consolidating
16 July 2019, 09:43
| Scenario | |
|---|---|
| Timeframe | Intraday |
| Recommendation | BUY STOP |
| Entry Point | 1426.95 |
| Take Profit | 1455.00 |
| Stop Loss | 1410.00 |
| Key Levels | 1347.94, 1357.90, 1381.50, 1400.60, 1426.91, 1439.11, 1455.00 |
| Alternative scenario | |
|---|---|
| Recommendation | SELL STOP |
| Entry Point | 1400.55 |
| Take Profit | 1370.00, 1357.90 |
| Stop Loss | 1420.00 |
| Key Levels | 1347.94, 1357.90, 1381.50, 1400.60, 1426.91, 1439.11, 1455.00 |
Current trend
Yesterday, gold prices traded in different directions, responding to the publication of ambiguous macroeconomic statistics from China. The quotes were supported by steady growth in industrial output, while a negative factor was the slowdown in China’s GDP in annual terms to 27-year lows. Growth in demand for commodity assets is also due to expectations of the Fed’s interest rates decrease at the end of this month.
Today, investors are awaiting the publication of a block of macroeconomic statistics on retail sales and industrial production, which may clarify the prospects for a rate cut at the next meeting of the regulator. Tomorrow, the Fed will publish a monthly economic review, the so-called Beige book.
Support and resistance
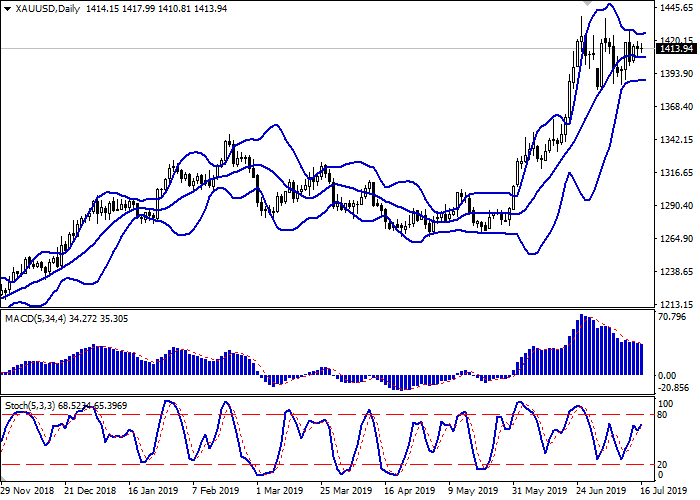
On the daily chart, Bollinger bands are moving flat. The price range is almost unchanged, indicating an ambiguous trend in the short term. The MACD indicator is falling, keeping a poor sell signal (the histogram is below the signal line). Stochastic keeps an uncertain upward direction, approaching its highs again.
To open new trading positions, it is better to wait for the clarification of signals from the technical indicators.
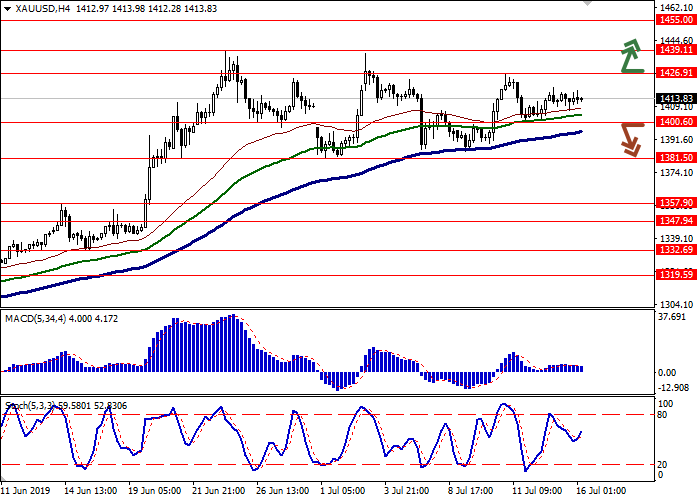
Resistance levels: 1426.91, 1439.11, 1455.00.
Support levels: 1400.60, 1381.50, 1357.90, 1347.94.


Trading tips
Long positions can be opened after the breakout of the level of 1426.91 with the target at 1455.00. Stop loss is 1410.00.
Short positions can be opened after the breakdown of the level of 1400.60 with the target at 1370.00 or 1357.90. Stop loss is 1420.00.
Implementation period: 2–3 days.
Yesterday, gold prices traded in different directions, responding to the publication of ambiguous macroeconomic statistics from China. The quotes were supported by steady growth in industrial output, while a negative factor was the slowdown in China’s GDP in annual terms to 27-year lows. Growth in demand for commodity assets is also due to expectations of the Fed’s interest rates decrease at the end of this month.
Today, investors are awaiting the publication of a block of macroeconomic statistics on retail sales and industrial production, which may clarify the prospects for a rate cut at the next meeting of the regulator. Tomorrow, the Fed will publish a monthly economic review, the so-called Beige book.
Support and resistance
On the daily chart, Bollinger bands are moving flat. The price range is almost unchanged, indicating an ambiguous trend in the short term. The MACD indicator is falling, keeping a poor sell signal (the histogram is below the signal line). Stochastic keeps an uncertain upward direction, approaching its highs again.
To open new trading positions, it is better to wait for the clarification of signals from the technical indicators.
Resistance levels: 1426.91, 1439.11, 1455.00.
Support levels: 1400.60, 1381.50, 1357.90, 1347.94.


Trading tips
Long positions can be opened after the breakout of the level of 1426.91 with the target at 1455.00. Stop loss is 1410.00.
Short positions can be opened after the breakdown of the level of 1400.60 with the target at 1370.00 or 1357.90. Stop loss is 1420.00.
Implementation period: 2–3 days.


No comments:
Write comments