USD/CHF: USD is correcting
16 July 2019, 09:52
| Scenario | |
|---|---|
| Timeframe | Intraday |
| Recommendation | BUY STOP |
| Entry Point | 0.9865, 0.9880 |
| Take Profit | 0.9930, 0.9960 |
| Stop Loss | 0.9840, 0.9820 |
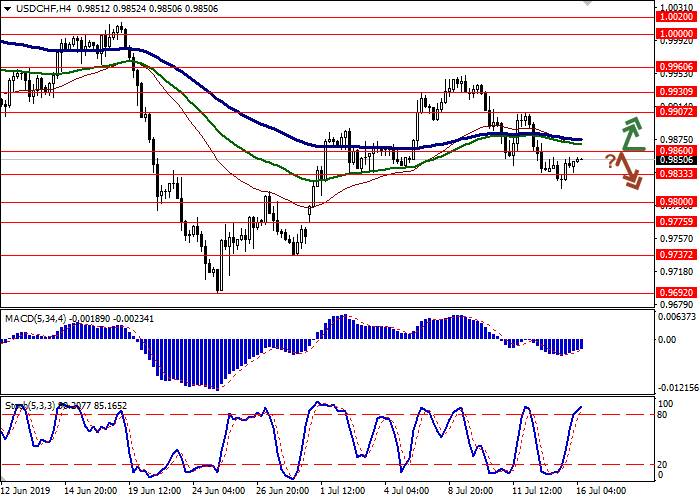
| Key Levels | 0.9737, 0.9775, 0.9800, 0.9833, 0.9860, 0.9907, 0.9930, 0.9960 |
| Alternative scenario | |
|---|---|
| Recommendation | SELL STOP |
| Entry Point | 0.9830 |
| Take Profit | 0.9775, 0.9750, 0.9737 |
| Stop Loss | 0.9875 |
| Key Levels | 0.9737, 0.9775, 0.9800, 0.9833, 0.9860, 0.9907, 0.9930, 0.9960 |
Current trend
The US dollar showed correctional growth against the Swiss franc on Monday, departing from the updated local lows of July 1. The reason for the emergence of positive dynamics was ambiguous macroeconomic data from China, which indicated a slowdown in YoY GDP to a 27-year low, but also reflected a sharp increase in industrial output and retail sales. Additional support for the dollar was provided by the published New York Fed Manufacturing PMI. In July, the indicator rose from −8.6 to 4.3 points, with a forecast of growth only to 2.0 points.
Published statistics from Switzerland was negative and also contributed to the development of positive dynamics in the instrument. The producer and import price index in June showed a decrease of 0.5% MoM and 1.4% YoY, which was noticeably worse than market expectations of 0.0% MoM and −0.9% YoY.
Support and resistance
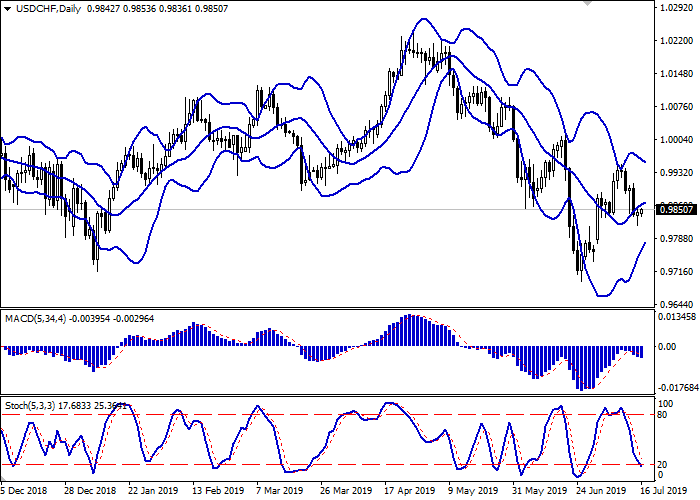
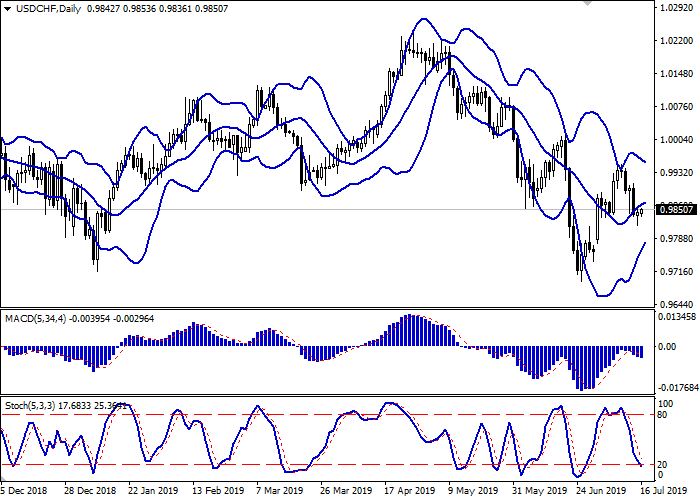
Bollinger Bands in D1 chart show moderate growth. The price range is narrowing, reflecting the ambiguous dynamics in the short term. MACD is going down preserving a weak sell signal (being located under the signal line). Stochastic is declining, approaching its minima, which indicates the development of corrective growth in the ultra-short term.
There's a possibility of a correctional growth in the short and/or ultra-short term.
Resistance levels: 0.9860, 0.9907, 0.9930, 0.9960.
Support levels: 0.9833, 0.9800, 0.9775, 0.9737.


Trading tips
To open long positions, one can rely on the breakout of 0.9860–0.9875. Take profit – 0.9930 or 0.9960. Stop loss – 0.9840–0.9820.
A rebound from 0.9860, as from resistance, followed by a breakdown of 0.9833, may become a signal for returning to the sales with the target at 0.9775 or 0.9750–0.9737. Stop loss – 0.9875.
Implementation period: 2-3 days.
The US dollar showed correctional growth against the Swiss franc on Monday, departing from the updated local lows of July 1. The reason for the emergence of positive dynamics was ambiguous macroeconomic data from China, which indicated a slowdown in YoY GDP to a 27-year low, but also reflected a sharp increase in industrial output and retail sales. Additional support for the dollar was provided by the published New York Fed Manufacturing PMI. In July, the indicator rose from −8.6 to 4.3 points, with a forecast of growth only to 2.0 points.
Published statistics from Switzerland was negative and also contributed to the development of positive dynamics in the instrument. The producer and import price index in June showed a decrease of 0.5% MoM and 1.4% YoY, which was noticeably worse than market expectations of 0.0% MoM and −0.9% YoY.
Support and resistance
Bollinger Bands in D1 chart show moderate growth. The price range is narrowing, reflecting the ambiguous dynamics in the short term. MACD is going down preserving a weak sell signal (being located under the signal line). Stochastic is declining, approaching its minima, which indicates the development of corrective growth in the ultra-short term.
There's a possibility of a correctional growth in the short and/or ultra-short term.
Resistance levels: 0.9860, 0.9907, 0.9930, 0.9960.
Support levels: 0.9833, 0.9800, 0.9775, 0.9737.


Trading tips
To open long positions, one can rely on the breakout of 0.9860–0.9875. Take profit – 0.9930 or 0.9960. Stop loss – 0.9840–0.9820.
A rebound from 0.9860, as from resistance, followed by a breakdown of 0.9833, may become a signal for returning to the sales with the target at 0.9775 or 0.9750–0.9737. Stop loss – 0.9875.
Implementation period: 2-3 days.


No comments:
Write comments