AUD/USD: AUD is growing
16 July 2019, 09:42
| Scenario | |
|---|---|
| Timeframe | Intraday |
| Recommendation | BUY STOP |
| Entry Point | 0.7050 |
| Take Profit | 0.7100 |
| Stop Loss | 0.7021 |
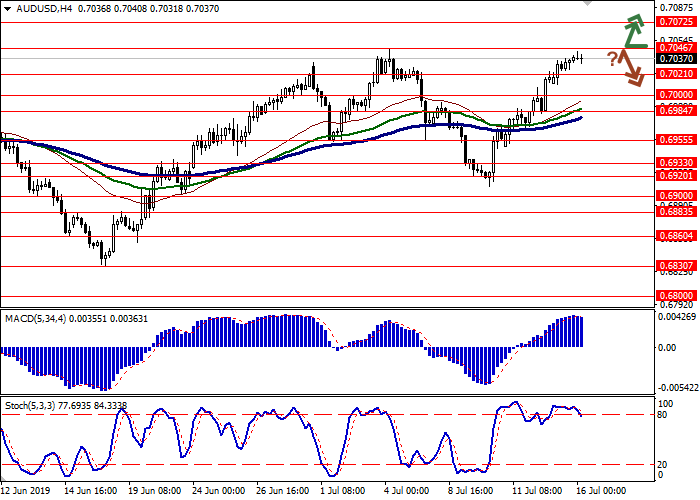
| Key Levels | 0.6955, 0.6984, 0.7000, 0.7021, 0.7046, 0.7072, 0.7100 |
| Alternative scenario | |
|---|---|
| Recommendation | SELL STOP |
| Entry Point | 0.7015 |
| Take Profit | 0.6955, 0.6933 |
| Stop Loss | 0.7046, 0.7060 |
| Key Levels | 0.6955, 0.6984, 0.7000, 0.7021, 0.7046, 0.7072, 0.7100 |
Current trend
The Australian dollar continues to grow steadily against the US one, updating local highs since July 4. Monday's macroeconomic statistics from China provided strong support to AUD. The data indicated a sharp increase in industrial output in June from 5.0% to 6.3% YoY, with a forecast of 5.2% YoY. China's quarterly GDP accelerated from 1.4% to 1.6% (forecast 1.5% QoQ). YoY, as analysts had expected, GDP slowed down from 6.4% to 6.2%.
Today, the pair is trading in both directions, waiting for the appearance of new drivers on the market. Investors are focused on the protocol of the RBA meeting of July 2, at which the regulator decided to reduce the interest rate by 25 basis points to 1.00%.
Support and resistance
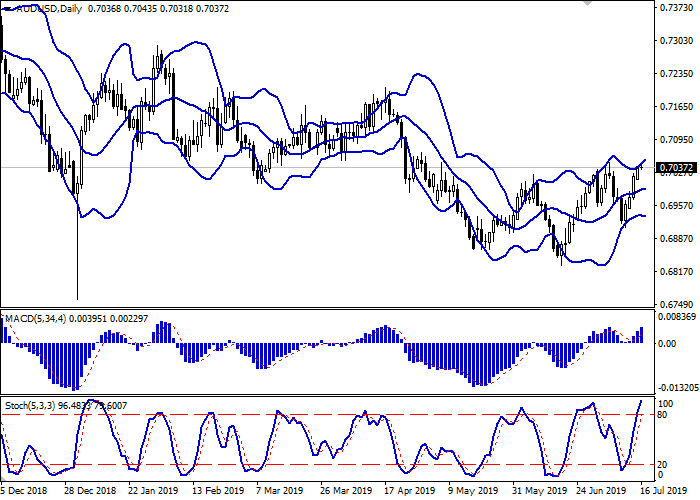
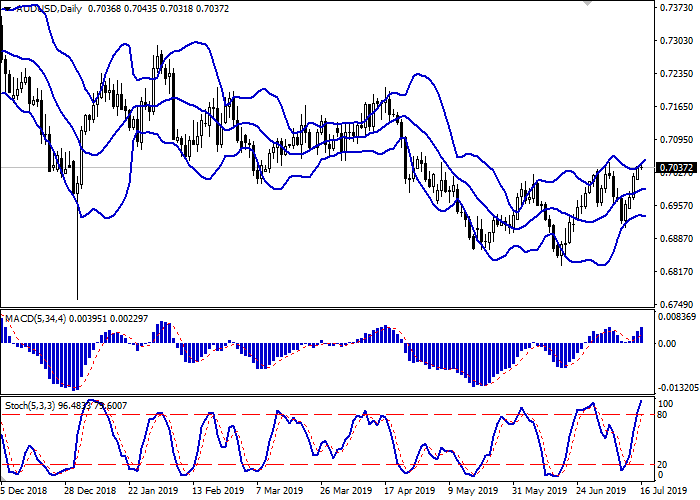
Bollinger Bands in D1 chart show moderate growth. The price range expands from above, freeing a path to new local highs for the "bulls". MACD indicator is growing preserving a stable buy signal (the histogram is above the signal line). Stochastic retains a steadily upward direction but is located in close proximity to its maximum values, which indicates the overbought instrument in the ultra-short term.
One should keep existing long positions until clarification. The opening of new purchases should be put on hold.
Resistance levels: 0.7046, 0.7072, 0.7100.
Support levels: 0.7021, 0.7000, 0.6984, 0.6955.


Trading tips
To open long positions, one can rely on the breakout of 0.7046. Take-profit – 0.7100. Stop loss – 0.7021.
A rebound from 0.7046, as from resistance, followed by a breakdown of 0.7021, may become a signal for returning to the sales with the target at 0.6955 or 0.6933. Stop loss – 0.7046–0.7060.
Implementation period: 2-3 days.
The Australian dollar continues to grow steadily against the US one, updating local highs since July 4. Monday's macroeconomic statistics from China provided strong support to AUD. The data indicated a sharp increase in industrial output in June from 5.0% to 6.3% YoY, with a forecast of 5.2% YoY. China's quarterly GDP accelerated from 1.4% to 1.6% (forecast 1.5% QoQ). YoY, as analysts had expected, GDP slowed down from 6.4% to 6.2%.
Today, the pair is trading in both directions, waiting for the appearance of new drivers on the market. Investors are focused on the protocol of the RBA meeting of July 2, at which the regulator decided to reduce the interest rate by 25 basis points to 1.00%.
Support and resistance
Bollinger Bands in D1 chart show moderate growth. The price range expands from above, freeing a path to new local highs for the "bulls". MACD indicator is growing preserving a stable buy signal (the histogram is above the signal line). Stochastic retains a steadily upward direction but is located in close proximity to its maximum values, which indicates the overbought instrument in the ultra-short term.
One should keep existing long positions until clarification. The opening of new purchases should be put on hold.
Resistance levels: 0.7046, 0.7072, 0.7100.
Support levels: 0.7021, 0.7000, 0.6984, 0.6955.


Trading tips
To open long positions, one can rely on the breakout of 0.7046. Take-profit – 0.7100. Stop loss – 0.7021.
A rebound from 0.7046, as from resistance, followed by a breakdown of 0.7021, may become a signal for returning to the sales with the target at 0.6955 or 0.6933. Stop loss – 0.7046–0.7060.
Implementation period: 2-3 days.


No comments:
Write comments