WTI Crude Oil: oil prices are corrected
04 July 2019, 09:49
| Scenario | |
|---|---|
| Timeframe | Intraday |
| Recommendation | BUY STOP |
| Entry Point | 57.45 |
| Take Profit | 60.00 |
| Stop Loss | 56.25, 56.45 |
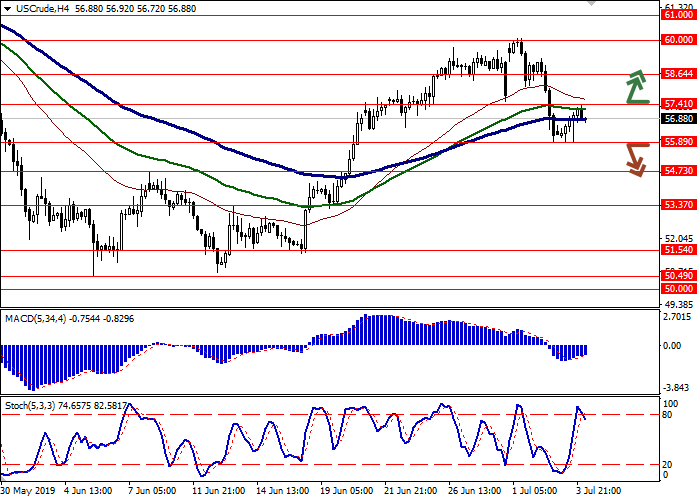
| Key Levels | 51.54, 53.37, 54.73, 55.89, 57.41, 58.64, 60.00, 61.00 |
| Alternative scenario | |
|---|---|
| Recommendation | SELL STOP |
| Entry Point | 55.80 |
| Take Profit | 53.37, 53.00 |
| Stop Loss | 57.00 |
| Key Levels | 51.54, 53.37, 54.73, 55.89, 57.41, 58.64, 60.00, 61.00 |
Current trend
Oil prices rose moderately on July 3, partially recovering from a sharp decline on Tuesday. Quotes continued to be supported by the positive results of the OPEC+ meeting, at which it was decided to extend the existing agreement to restrict supplies for another 9 months. The growth was also supported by the API report on oil reserves, published on Tuesday, which indicated a reduction by 5 million barrels. On Wednesday, the US Department of Energy published a report, which failed to meet expectations. For the week of June 28, according to EIA, oil reserves fell by only 1.085 million barrels after a decline of a record 12.788 million for the last period. The report also reflected growth in US oil production from 12,100 to 12,200 million barrels per day.
Support and resistance
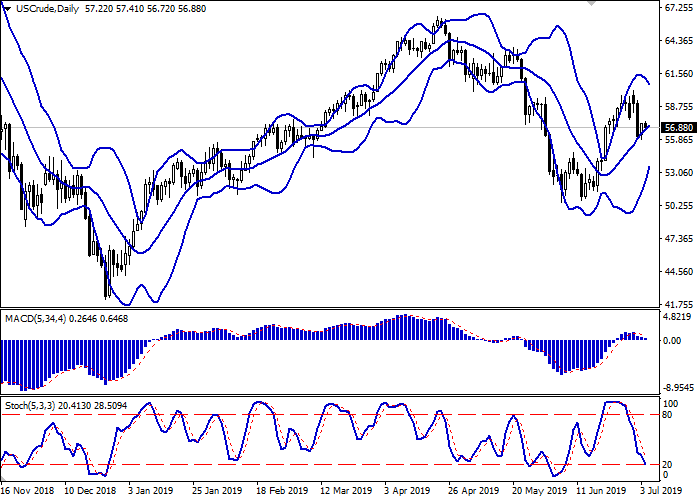
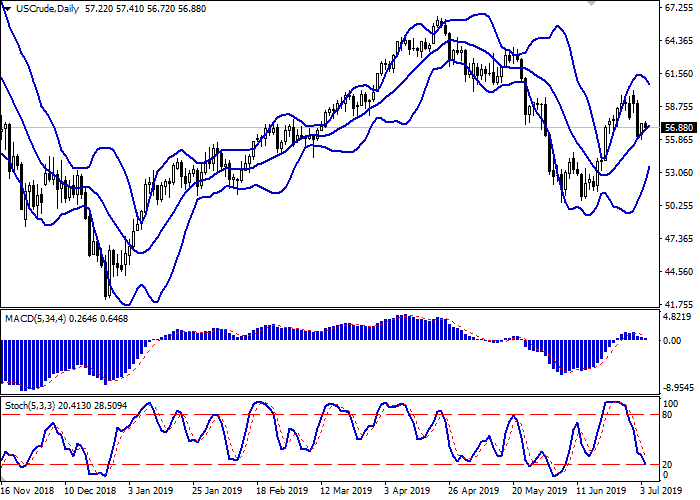
Bollinger Bands in D1 chart show moderate growth. The price range is narrowing, reflecting the ambiguous dynamics in the short term. MACD is going down preserving a weak sell signal (being located under the signal line). Moreover, the indicator is trying to consolidate below the zero mark at the moment. Stochastic also maintains a confident downward direction but is quickly approaching its minimum marks, which indicates the oversold risks in the ultra-short term.
The showings of the indicators do not contradict the further development of the "bearish" trend in the short and/or ultra-short term.
Resistance levels: 57.41, 58.64, 60.00, 61.00.
Support levels: 55.89, 54.73, 53.37, 51.54.


Trading tips
To open long positions, one can rely on the breakout of 57.41. Take-profit – 60.00. Stop loss – 56.25–56.45.
A confident breakdown of 55.89 may serve as a signal to further sales with the target at 53.37–53.00. Stop loss – 57.00.
Implementation period: 2-3 days.
Oil prices rose moderately on July 3, partially recovering from a sharp decline on Tuesday. Quotes continued to be supported by the positive results of the OPEC+ meeting, at which it was decided to extend the existing agreement to restrict supplies for another 9 months. The growth was also supported by the API report on oil reserves, published on Tuesday, which indicated a reduction by 5 million barrels. On Wednesday, the US Department of Energy published a report, which failed to meet expectations. For the week of June 28, according to EIA, oil reserves fell by only 1.085 million barrels after a decline of a record 12.788 million for the last period. The report also reflected growth in US oil production from 12,100 to 12,200 million barrels per day.
Support and resistance
Bollinger Bands in D1 chart show moderate growth. The price range is narrowing, reflecting the ambiguous dynamics in the short term. MACD is going down preserving a weak sell signal (being located under the signal line). Moreover, the indicator is trying to consolidate below the zero mark at the moment. Stochastic also maintains a confident downward direction but is quickly approaching its minimum marks, which indicates the oversold risks in the ultra-short term.
The showings of the indicators do not contradict the further development of the "bearish" trend in the short and/or ultra-short term.
Resistance levels: 57.41, 58.64, 60.00, 61.00.
Support levels: 55.89, 54.73, 53.37, 51.54.


Trading tips
To open long positions, one can rely on the breakout of 57.41. Take-profit – 60.00. Stop loss – 56.25–56.45.
A confident breakdown of 55.89 may serve as a signal to further sales with the target at 53.37–53.00. Stop loss – 57.00.
Implementation period: 2-3 days.


No comments:
Write comments