USD/JPY: the pair is showing ambiguous dynamics
15 July 2019, 09:50
| Scenario | |
|---|---|
| Timeframe | Intraday |
| Recommendation | BUY STOP |
| Entry Point | 108.60 |
| Take Profit | 109.30 |
| Stop Loss | 108.20 |
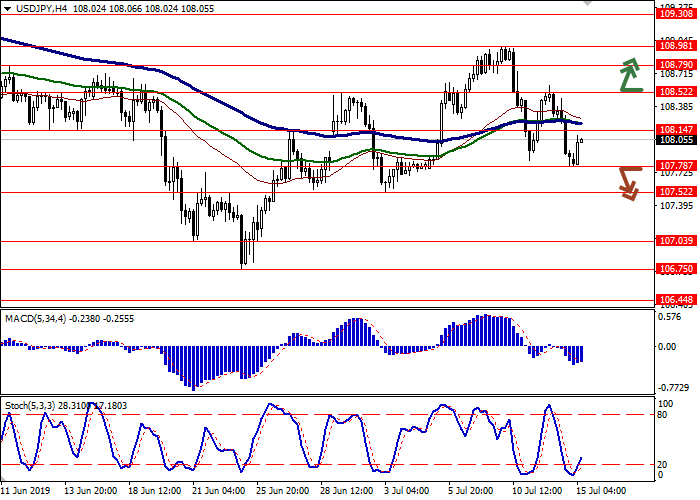
| Key Levels | 106.75, 107.03, 107.52, 107.78, 108.14, 108.52, 108.79, 108.98 |
| Alternative scenario | |
|---|---|
| Recommendation | SELL STOP |
| Entry Point | 107.70 |
| Take Profit | 107.03 |
| Stop Loss | 108.00, 108.14 |
| Key Levels | 106.75, 107.03, 107.52, 107.78, 108.14, 108.52, 108.79, 108.98 |
Current trend
The US dollar showed a steady decline against the Japanese yen on Friday, updating local lows of July 5. It is curious that this happened amid the publication of weak macroeconomic statistics from Japan. In May, industrial output in Japan slowed down from 2.3% MoM to 2.0% MoM. YoY, the decline in production increased from −1.8% to −2.1%, which turned out to be worse than market expectations.
Today, the pair is trading in an uptrend. Japan's markets are closed on Monday to celebrate the Marine Day, so statistics from China and the United States remain in the spotlight. Chinese data on GDP, retail sales, and industrial output were stronger than forecasts, which contributed to the growth of investor interest in risk. With the opening of the American session, investors are awaiting the publication of the index of the July Manufacturing PMI from the New York FRB.
Support and resistance
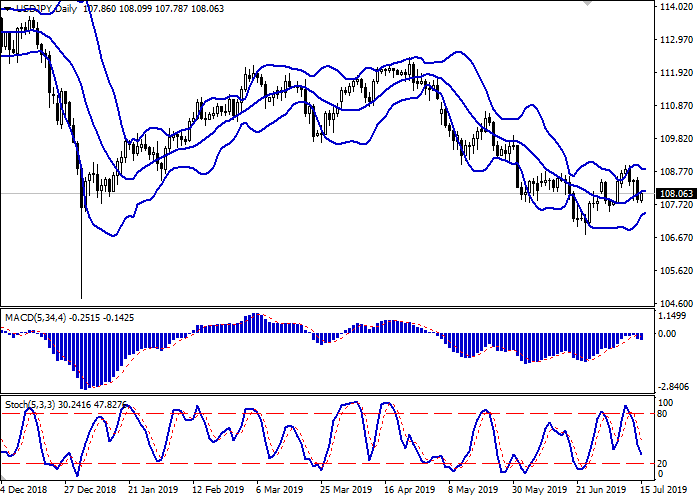
On the D1 chart, Bollinger Bands are reversing horizontally. The price range is narrowing, reflecting the ambiguous dynamics in the short term. MACD is reversing down and forming a sell signal (being located under the signal line). Stochastic is declining, rapidly approaching its minima, which indicating the risks of the oversold dollar in the ultra-short term.
The current showings of the indicators do not contradict the further development of the downtrend in the short and/or ultra-short term.
Resistance levels: 108.14, 108.52, 108.79, 108.98.
Support levels: 107.78, 107.52, 107.03, 106.75.


Trading tips
To open long positions, one can rely on the breakout of 108.52. Take-profit – 109.30. Stop loss – 108.20.
A confident breakdown of 107.78 may serve as a signal to further sales with the target at 107.03. Stop loss – 108.00–108.14.
Implementation period: 2-3 days.
The US dollar showed a steady decline against the Japanese yen on Friday, updating local lows of July 5. It is curious that this happened amid the publication of weak macroeconomic statistics from Japan. In May, industrial output in Japan slowed down from 2.3% MoM to 2.0% MoM. YoY, the decline in production increased from −1.8% to −2.1%, which turned out to be worse than market expectations.
Today, the pair is trading in an uptrend. Japan's markets are closed on Monday to celebrate the Marine Day, so statistics from China and the United States remain in the spotlight. Chinese data on GDP, retail sales, and industrial output were stronger than forecasts, which contributed to the growth of investor interest in risk. With the opening of the American session, investors are awaiting the publication of the index of the July Manufacturing PMI from the New York FRB.
Support and resistance
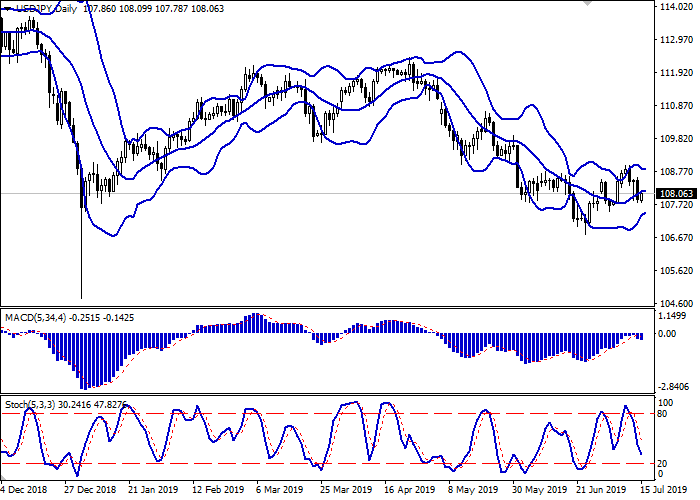
On the D1 chart, Bollinger Bands are reversing horizontally. The price range is narrowing, reflecting the ambiguous dynamics in the short term. MACD is reversing down and forming a sell signal (being located under the signal line). Stochastic is declining, rapidly approaching its minima, which indicating the risks of the oversold dollar in the ultra-short term.
The current showings of the indicators do not contradict the further development of the downtrend in the short and/or ultra-short term.
Resistance levels: 108.14, 108.52, 108.79, 108.98.
Support levels: 107.78, 107.52, 107.03, 106.75.


Trading tips
To open long positions, one can rely on the breakout of 108.52. Take-profit – 109.30. Stop loss – 108.20.
A confident breakdown of 107.78 may serve as a signal to further sales with the target at 107.03. Stop loss – 108.00–108.14.
Implementation period: 2-3 days.


No comments:
Write comments