USD/CAD: the instrument remains under pressure
15 July 2019, 09:49
| Scenario | |
|---|---|
| Timeframe | Intraday |
| Recommendation | BUY STOP |
| Entry Point | 1.3065 |
| Take Profit | 1.3200, 1.3228 |
| Stop Loss | 1.3000 |
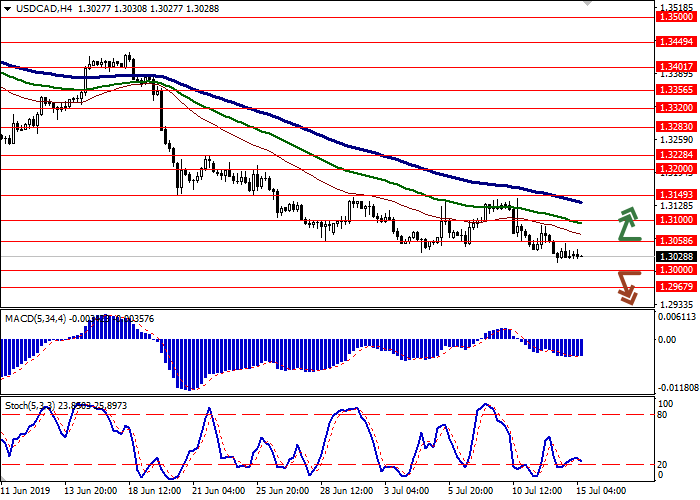
| Key Levels | 1.2914, 1.2967, 1.3000, 1.3058, 1.3100, 1.3149, 1.3200 |
| Alternative scenario | |
|---|---|
| Recommendation | SELL STOP |
| Entry Point | 1.2995 |
| Take Profit | 1.2914, 1.2900 |
| Stop Loss | 1.3058 |
| Key Levels | 1.2914, 1.2967, 1.3000, 1.3058, 1.3100, 1.3149, 1.3200 |
Current trend
On Friday, the USD/CAD pair was steadily declining, renewing lows since October 2018. The development of negative dynamics was due to the correctional sentiment on USD. Investors are still cautious about buying the dollar, waiting for a possible easing of the Fed's monetary policy. The latest report on US employment has slightly reduced the prospects for lowering the rate at the end of July but most analysts are still confident that the regulator will take this step.
Today, during the Asian session, investors are focused on the block of macroeconomic statistics from China. Retail sales in June rose by 9.8% YoY after rising by 8.6% YoY last month. Analysts expected a slowdown to +8.3% YoY. Industrial production for the same period rose by 6.3% YoY after an increase of 5.0% YoY in May. China's Q2 GDP accelerated from +1.4% QoQ to +1.6% QoQ, which was better than expected +1.5%.
Support and resistance
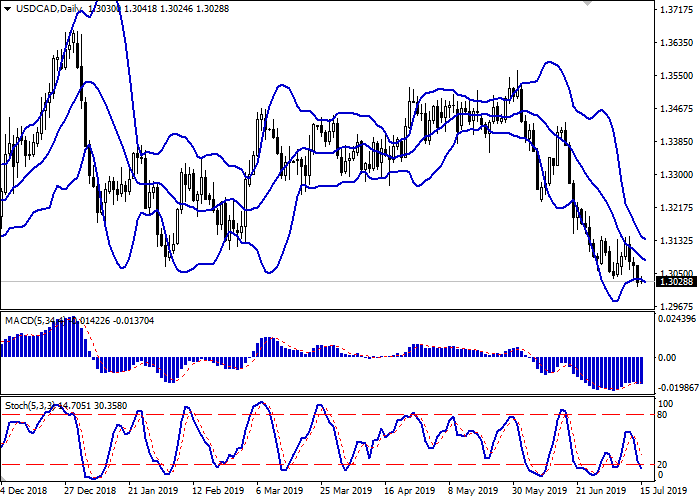
On the daily chart, Bollinger bands steadily decline. The price range narrows, reflecting the ambiguous trading mood in the short/medium term. After a brief increase, the MACD reversed downwards, forming a new sell signal (the histogram is trying to consolidate below the zero line). Stochastic’s dynamics is the same but it is near its lows, which indicates that the instrument is oversold in the super short term.
Resistance levels: 1.3058, 1.3100, 1.3149, 1.3200.
Support levels: 1.3000, 1.2967, 1.2914.


Trading tips
Long positions can be opened after the breakout of 1.3058 with the target at 1.3200 or 1.3228. Stop loss is 1.3000.
Short positions can be opened after the breakdown of 1.3000 with the targets at 1.2914–1.2900. Stop loss is 1.3058.
Implementation period: 2–3 days.
On Friday, the USD/CAD pair was steadily declining, renewing lows since October 2018. The development of negative dynamics was due to the correctional sentiment on USD. Investors are still cautious about buying the dollar, waiting for a possible easing of the Fed's monetary policy. The latest report on US employment has slightly reduced the prospects for lowering the rate at the end of July but most analysts are still confident that the regulator will take this step.
Today, during the Asian session, investors are focused on the block of macroeconomic statistics from China. Retail sales in June rose by 9.8% YoY after rising by 8.6% YoY last month. Analysts expected a slowdown to +8.3% YoY. Industrial production for the same period rose by 6.3% YoY after an increase of 5.0% YoY in May. China's Q2 GDP accelerated from +1.4% QoQ to +1.6% QoQ, which was better than expected +1.5%.
Support and resistance
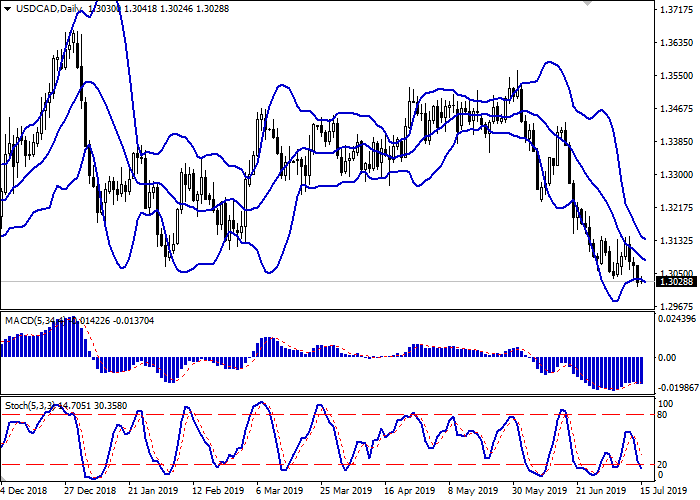
On the daily chart, Bollinger bands steadily decline. The price range narrows, reflecting the ambiguous trading mood in the short/medium term. After a brief increase, the MACD reversed downwards, forming a new sell signal (the histogram is trying to consolidate below the zero line). Stochastic’s dynamics is the same but it is near its lows, which indicates that the instrument is oversold in the super short term.
Resistance levels: 1.3058, 1.3100, 1.3149, 1.3200.
Support levels: 1.3000, 1.2967, 1.2914.


Trading tips
Long positions can be opened after the breakout of 1.3058 with the target at 1.3200 or 1.3228. Stop loss is 1.3000.
Short positions can be opened after the breakdown of 1.3000 with the targets at 1.2914–1.2900. Stop loss is 1.3058.
Implementation period: 2–3 days.


No comments:
Write comments