Brent Crude Oil: oil prices are consolidating
15 July 2019, 09:28
| Scenario | |
|---|---|
| Timeframe | Intraday |
| Recommendation | BUY STOP |
| Entry Point | 67.45 |
| Take Profit | 68.63, 69.00 |
| Stop Loss | 66.68 |
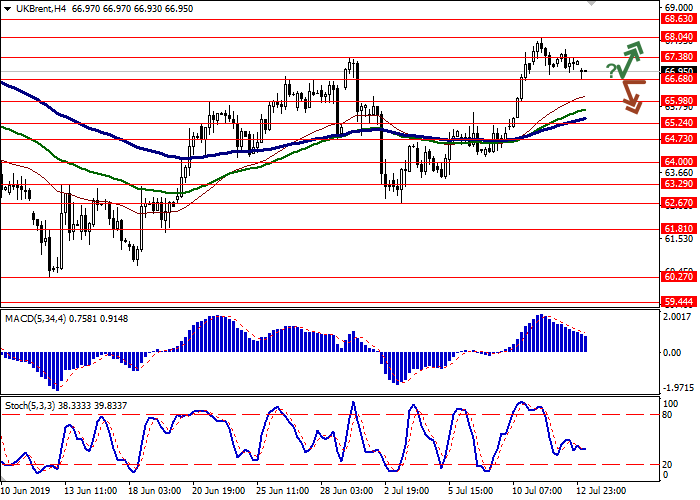
| Key Levels | 64.73, 65.24, 65.98, 66.68, 67.38, 68.04, 68.63 |
| Alternative scenario | |
|---|---|
| Recommendation | SELL STOP |
| Entry Point | 66.60 |
| Take Profit | 65.24, 64.73 |
| Stop Loss | 67.38 |
| Key Levels | 64.73, 65.24, 65.98, 66.68, 67.38, 68.04, 68.63 |
Current trend
Oil prices are consolidating near local highs, updated at the end of the week. Quotes are supported by a reduction in the production of some US manufacturers in the Gulf of Mexico due to a tropical storm. On the other hand, investors were disappointed with the published report of the International Energy Agency. According to it, further growth in production in the USA will contribute to the growing imbalance of supply and demand in the market. The IEA expects a decline in oil demand by 2020 to a record level since 2003. Additional support for quotes was provided by Baker Hughes report on active oil platforms in the USA published on Friday. During the week, the number of drilling rigs decreased from 788 to 784 units.
Support and resistance
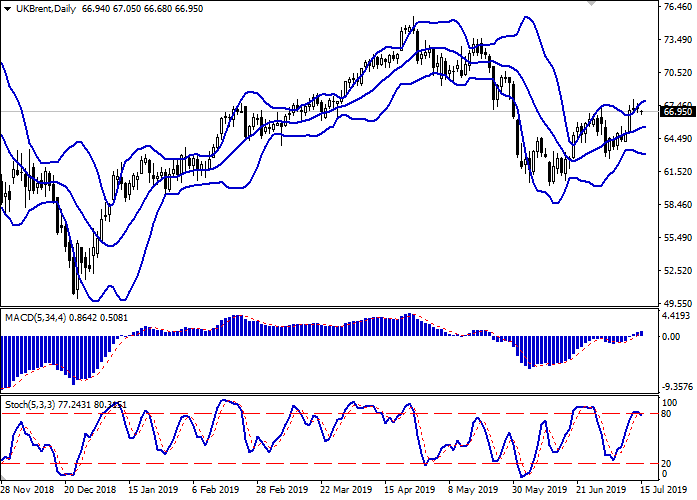
On the D1 chart, Bollinger Bands show a slight increase and a tendency to reverse horizontally. MACD indicator is growing preserving a weak buy signal (histogram is above the signal line). Stochastic, approaching its maxima, is trying to reverse down, indicating the risks of an overbought instrument in the ultra-short term.
One should wait for the clarification and formation of new trade signals.
Resistance levels: 67.38, 68.04, 68.63.
Support levels: 66.68, 65.98, 65.24, 64.73.


Trading tips
Long positions may be opened if the price moves away from 66.68, as from support, followed by the breakout of 67.38. Take profit – 68.63 or 69.00. Stop loss – 66.68. Implementation period: 1-2 days.
A confident breakdown of 66.68 may serve as a signal to further sales with the target at 65.24 or 64.73. Stop loss – 67.38. Implementation period: 2-3 days.
Oil prices are consolidating near local highs, updated at the end of the week. Quotes are supported by a reduction in the production of some US manufacturers in the Gulf of Mexico due to a tropical storm. On the other hand, investors were disappointed with the published report of the International Energy Agency. According to it, further growth in production in the USA will contribute to the growing imbalance of supply and demand in the market. The IEA expects a decline in oil demand by 2020 to a record level since 2003. Additional support for quotes was provided by Baker Hughes report on active oil platforms in the USA published on Friday. During the week, the number of drilling rigs decreased from 788 to 784 units.
Support and resistance
On the D1 chart, Bollinger Bands show a slight increase and a tendency to reverse horizontally. MACD indicator is growing preserving a weak buy signal (histogram is above the signal line). Stochastic, approaching its maxima, is trying to reverse down, indicating the risks of an overbought instrument in the ultra-short term.
One should wait for the clarification and formation of new trade signals.
Resistance levels: 67.38, 68.04, 68.63.
Support levels: 66.68, 65.98, 65.24, 64.73.


Trading tips
Long positions may be opened if the price moves away from 66.68, as from support, followed by the breakout of 67.38. Take profit – 68.63 or 69.00. Stop loss – 66.68. Implementation period: 1-2 days.
A confident breakdown of 66.68 may serve as a signal to further sales with the target at 65.24 or 64.73. Stop loss – 67.38. Implementation period: 2-3 days.


No comments:
Write comments