
USD/CAD: US dollar strengthened
23 July 2019, 09:37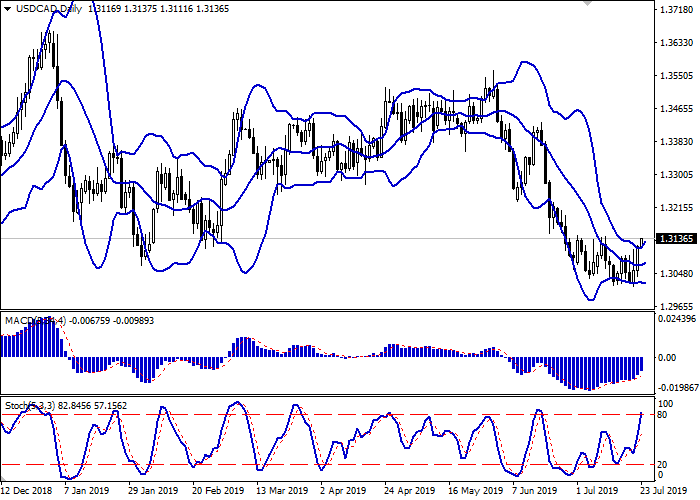
| Scenario | |
|---|---|
| Timeframe | Intraday |
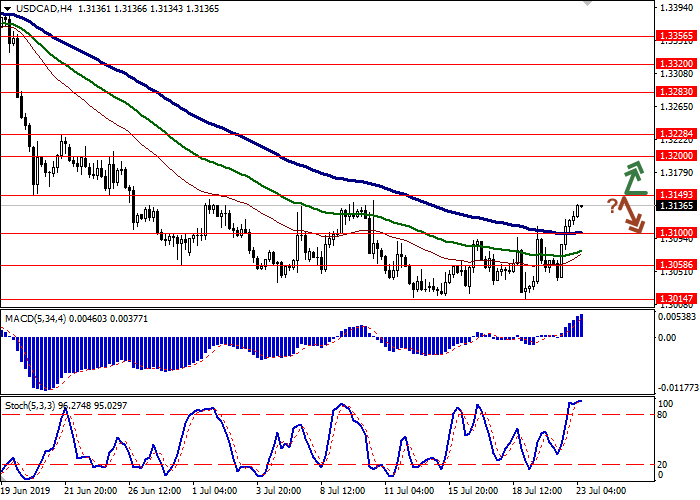
| Recommendation | BUY STOP |
| Entry Point | 1.3155 |
| Take Profit | 1.3228, 1.3250 |
| Stop Loss | 1.3100 |
| Key Levels | 1.3014, 1.3058, 1.3100, 1.3149, 1.3200, 1.3228, 1.3283 |
| Alternative scenario | |
|---|---|
| Recommendation | SELL STOP |
| Entry Point | 1.3115, 1.3105 |
| Take Profit | 1.3014, 1.3000 |
| Stop Loss | 1.3150, 1.3160 |
| Key Levels | 1.3014, 1.3058, 1.3100, 1.3149, 1.3200, 1.3228, 1.3283 |
Current trend
Yesterday, the USD/CAD pair rose significantly, renewing the highs since July 10. The growth of the American currency was largely due to technical factors, while the macroeconomic background remained controversial. For example, the Chicago Fed index of national activity, published on Monday, rose from –0.03 to –0.02 points in June, while investors expected the figure to rise to 0.10 points. Additional support for the instrument was provided by poor macroeconomic data from Canada. Wholesale sales in Canada fell by 1.8% MoM in May after rising by 1.6% MoM last month. Analysts had expected positive dynamics of +0.5% MoM.
Support and resistance
On the daily chart, Bollinger bands are slightly increasing. The price range is slowly expanding from above but not as fast as the correction impulse develops. The MACD indicator is growing, maintaining a buy signal (the histogram is above the signal line). Stochastic is directed upwards but is rapidly approaching its highs, which indicates that USD may become overbought in the super short term.
The current readings of the indicators do not contradict the further development of the upward trend in the short and/or super short term.
Resistance levels: 1.3149, 1.3200, 1.3228, 1.3283.
Support levels: 1.3100, 1.3058, 1.3014.

Trading tips
Long positions can be opened after the breakout of the level of 1.3149 with the target at 1.3228 or 1.3250. Stop loss is 1.3100.
Short positions can be opened after a rebound from the level of 1.3149 and a breakdown of the levels of 1.3120–1.3110 with the targets at 1.3014–1.3000. Stop loss is 1.3150–1.3160.
Implementation period: 2–3 days.
Yesterday, the USD/CAD pair rose significantly, renewing the highs since July 10. The growth of the American currency was largely due to technical factors, while the macroeconomic background remained controversial. For example, the Chicago Fed index of national activity, published on Monday, rose from –0.03 to –0.02 points in June, while investors expected the figure to rise to 0.10 points. Additional support for the instrument was provided by poor macroeconomic data from Canada. Wholesale sales in Canada fell by 1.8% MoM in May after rising by 1.6% MoM last month. Analysts had expected positive dynamics of +0.5% MoM.
Support and resistance
On the daily chart, Bollinger bands are slightly increasing. The price range is slowly expanding from above but not as fast as the correction impulse develops. The MACD indicator is growing, maintaining a buy signal (the histogram is above the signal line). Stochastic is directed upwards but is rapidly approaching its highs, which indicates that USD may become overbought in the super short term.
The current readings of the indicators do not contradict the further development of the upward trend in the short and/or super short term.
Resistance levels: 1.3149, 1.3200, 1.3228, 1.3283.
Support levels: 1.3100, 1.3058, 1.3014.
Trading tips
Long positions can be opened after the breakout of the level of 1.3149 with the target at 1.3228 or 1.3250. Stop loss is 1.3100.
Short positions can be opened after a rebound from the level of 1.3149 and a breakdown of the levels of 1.3120–1.3110 with the targets at 1.3014–1.3000. Stop loss is 1.3150–1.3160.
Implementation period: 2–3 days.


No comments:
Write comments