
USD/JPY: USD is strengthening
23 July 2019, 09:36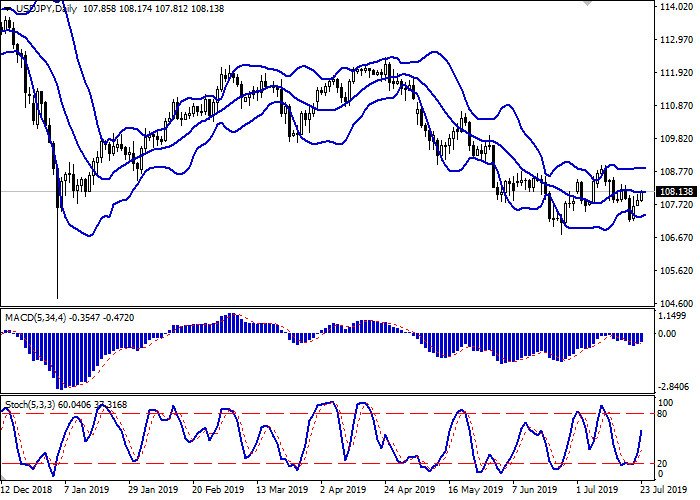
| Scenario | |
|---|---|
| Timeframe | Intraday |
| Recommendation | BUY STOP |
| Entry Point | 108.20 |
| Take Profit | 108.79, 108.98 |
| Stop Loss | 107.90, 107.80 |
| Key Levels | 107.03, 107.20, 107.52, 107.78, 108.17, 108.52, 108.79, 108.98 |
| Alternative scenario | |
|---|---|
| Recommendation | SELL STOP |
| Entry Point | 107.80, 107.75 |
| Take Profit | 107.30, 107.20 |
| Stop Loss | 108.20 |
| Key Levels | 107.03, 107.20, 107.52, 107.78, 108.17, 108.52, 108.79, 108.98 |
Current trend
The US dollar has been rising against the Japanese yen since the end of last week, recovering from local lows of June 26, updated last Thursday. On Monday, investors were focused on the speech of the head of the Bank of Japan, Haruhiko Kuroda, who reaffirmed his readiness to resume economic stimulation in the event of further growth in global uncertainty. In addition, Kuroda is ready for additional monetary easing to achieve a target inflation rate of 2%.
Today, the pair is trading in an uptrend. Market participants are waiting for the publication of US macroeconomic statistics. The focus will be on Redbook statistics on retail sales, as well as the dynamics of sales in the secondary housing market.
Support and resistance
Bollinger Bands in the D1 chart demonstrate flat dynamics. The price range is slightly narrowed акщь below, reflecting the change in the direction of trading in the short term. MACD indicator is growing preserving a weak buy signal (histogram is above the signal line). Stochastic shows more steady growth, but is rapidly approaching its maxima, indicating growing risks of the overbought dollar in the ultra-short term.
One should keep existing long positions until clarification.
Resistance levels: 108.17, 108.52, 108.79, 108.98.
Support levels: 107.78, 107.52, 107.20, 107.03.


Trading tips
To open long positions, one can rely on the breakout of 108.17. Take profit – 108.79 or 108.98. Stop loss – 107.90–107.80.
A rebound from 108.17, as from resistance, followed by a breakdown of 107.90–107.80, may become a signal for corrective sales with the target at 107.30–107.20. Stop loss – 108.20.
Implementation period: 2-3 days.
The US dollar has been rising against the Japanese yen since the end of last week, recovering from local lows of June 26, updated last Thursday. On Monday, investors were focused on the speech of the head of the Bank of Japan, Haruhiko Kuroda, who reaffirmed his readiness to resume economic stimulation in the event of further growth in global uncertainty. In addition, Kuroda is ready for additional monetary easing to achieve a target inflation rate of 2%.
Today, the pair is trading in an uptrend. Market participants are waiting for the publication of US macroeconomic statistics. The focus will be on Redbook statistics on retail sales, as well as the dynamics of sales in the secondary housing market.
Support and resistance
Bollinger Bands in the D1 chart demonstrate flat dynamics. The price range is slightly narrowed акщь below, reflecting the change in the direction of trading in the short term. MACD indicator is growing preserving a weak buy signal (histogram is above the signal line). Stochastic shows more steady growth, but is rapidly approaching its maxima, indicating growing risks of the overbought dollar in the ultra-short term.
One should keep existing long positions until clarification.
Resistance levels: 108.17, 108.52, 108.79, 108.98.
Support levels: 107.78, 107.52, 107.20, 107.03.
Trading tips
To open long positions, one can rely on the breakout of 108.17. Take profit – 108.79 or 108.98. Stop loss – 107.90–107.80.
A rebound from 108.17, as from resistance, followed by a breakdown of 107.90–107.80, may become a signal for corrective sales with the target at 107.30–107.20. Stop loss – 108.20.
Implementation period: 2-3 days.


No comments:
Write comments