USD/CAD: upward correction
10 July 2019, 09:37
| Scenario | |
|---|---|
| Timeframe | Intraday |
| Recommendation | BUY STOP |
| Entry Point | 1.3155 |
| Take Profit | 1.3250, 1.3283 |
| Stop Loss | 1.3100 |
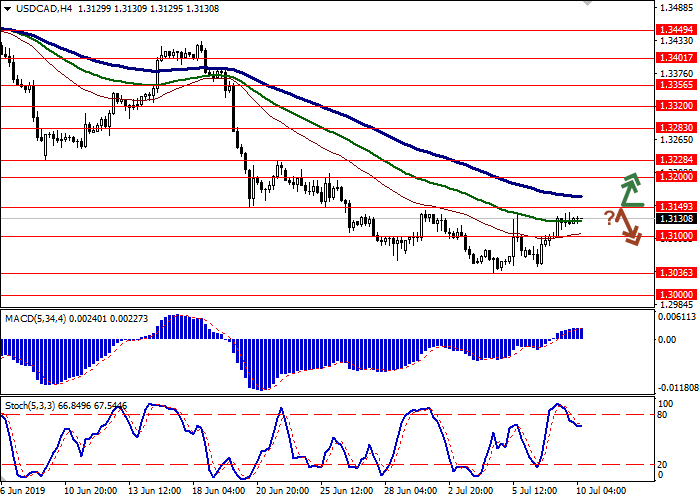
| Key Levels | 1.3000, 1.3036, 1.3100, 1.3149, 1.3200, 1.3228, 1.3283 |
| Alternative scenario | |
|---|---|
| Recommendation | SELL STOP |
| Entry Point | 1.3095 |
| Take Profit | 1.3000 |
| Stop Loss | 1.3149 |
| Key Levels | 1.3000, 1.3036, 1.3100, 1.3149, 1.3200, 1.3228, 1.3283 |
Current trend
Yesterday, the USD/CAD pair strengthened, renewing the highs since the beginning of the month. Consumer activity on USD is supported by expectations that the Fed will take a wait and refuse to raise rates during the July meeting amid the publication of a strong report on the US labor market. Yesterday’s Canadian macroeconomic statistics also contributed to the positive dynamics. The volume of May’s Building Permits fell sharply by 13.0% MoM after rising by 16.0% MoM last month.
Today, during the Asian session, the instrument trades ambiguously, awaiting the appearance of new drivers in the market. Investors are focused on the presentation of Fed Chairman Jerome Powell in Congress, as well as the publication of the Bank of Canada decision on interest rates with an accompanying press conference. It is predicted that the Canadian regulator will leave the parameters of monetary policy unchanged.
Support and resistance
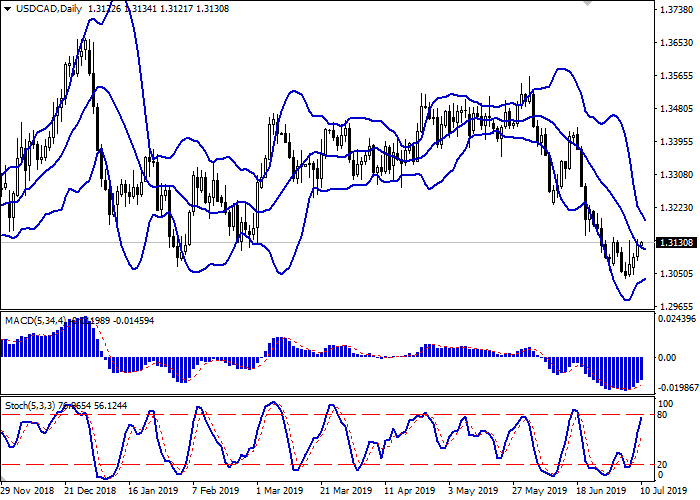
On the daily chart, Bollinger bands smoothly reverse horizontally. The price range narrows, reflecting the emergence of ambiguous dynamics in the short term. The MACD grows, keeping a strong buy signal (the histogram is above the signal line). Stochastic is directed upwards but is rapidly approaching its highs, which indicates that USD may become overbought in the super-short term.
It is better to keep current long positions and open new ones in the short and/or ultra-short term until the renewals of the indicators’ signals.
Resistance levels: 1.3149, 1.3200, 1.3228, 1.3283.
Support levels: 1.3100, 1.3036, 1.3000.


Trading tips
Long positions can be opened after the breakout of 1.3149 with the targets at 1.3250–1.3283. Stop loss is 1.3100.
Short positions can be opened after a rebound from 1.3149 and the breakdown of 1.3100 with the target at 1.3000. Stop loss is 1.3149. Implementation period: 2–3 days.
Yesterday, the USD/CAD pair strengthened, renewing the highs since the beginning of the month. Consumer activity on USD is supported by expectations that the Fed will take a wait and refuse to raise rates during the July meeting amid the publication of a strong report on the US labor market. Yesterday’s Canadian macroeconomic statistics also contributed to the positive dynamics. The volume of May’s Building Permits fell sharply by 13.0% MoM after rising by 16.0% MoM last month.
Today, during the Asian session, the instrument trades ambiguously, awaiting the appearance of new drivers in the market. Investors are focused on the presentation of Fed Chairman Jerome Powell in Congress, as well as the publication of the Bank of Canada decision on interest rates with an accompanying press conference. It is predicted that the Canadian regulator will leave the parameters of monetary policy unchanged.
Support and resistance
On the daily chart, Bollinger bands smoothly reverse horizontally. The price range narrows, reflecting the emergence of ambiguous dynamics in the short term. The MACD grows, keeping a strong buy signal (the histogram is above the signal line). Stochastic is directed upwards but is rapidly approaching its highs, which indicates that USD may become overbought in the super-short term.
It is better to keep current long positions and open new ones in the short and/or ultra-short term until the renewals of the indicators’ signals.
Resistance levels: 1.3149, 1.3200, 1.3228, 1.3283.
Support levels: 1.3100, 1.3036, 1.3000.


Trading tips
Long positions can be opened after the breakout of 1.3149 with the targets at 1.3250–1.3283. Stop loss is 1.3100.
Short positions can be opened after a rebound from 1.3149 and the breakdown of 1.3100 with the target at 1.3000. Stop loss is 1.3149. Implementation period: 2–3 days.


No comments:
Write comments