NZD/USD: the instrument is declining
10 July 2019, 09:41
| Scenario | |
|---|---|
| Timeframe | Intraday |
| Recommendation | BUY STOP |
| Entry Point | 0.6615 |
| Take Profit | 0.6680, 0.6707 |
| Stop Loss | 0.6580 |
| Key Levels | 0.6524, 0.6546, 0.6566, 0.6580, 0.6610, 0.6640, 0.6655, 0.6694 |
| Alternative scenario | |
|---|---|
| Recommendation | SELL STOP |
| Entry Point | 0.6575, 0.6560 |
| Take Profit | 0.6500 |
| Stop Loss | 0.6600, 0.6610 |
| Key Levels | 0.6524, 0.6546, 0.6566, 0.6580, 0.6610, 0.6640, 0.6655, 0.6694 |
Current trend
The New Zealand dollar showed a moderate decline against the US one on Tuesday, continuing the development of the "bearish" impulse formed on July 4. USD is still strengthened by the labor market report published at the end of last week, which pleasantly surprised investors with a sharp increase in employment. Now the market awaits the upcoming July 10 speech by Fed Chairman Jerome Powell in Congress. It is expected that Powell can take a waiting position and will advocate keeping the rate unchanged at the July meeting of the regulator.
Today, the instrument is traded in both directions. The confident decline in the first hours was replaced by an active correction, which somewhat weakened the position of ultra-short "bears". Published New Zealand statistics was weak. The food price index in June showed a sharp decline of 0.7% MoM with an expected decline of only 0.3% MoM.
Support and resistance
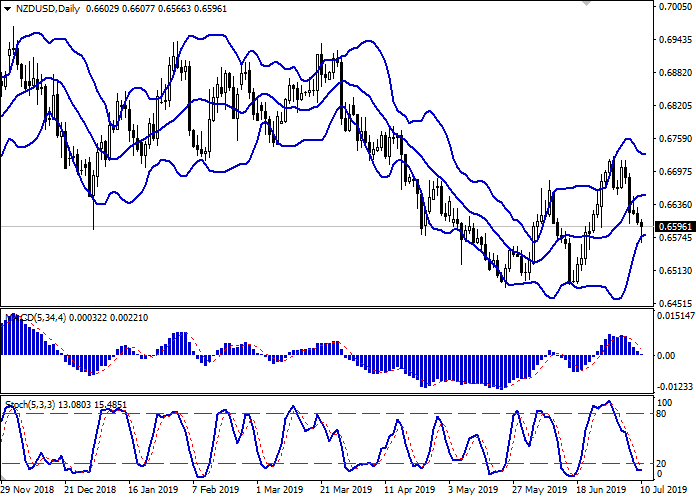
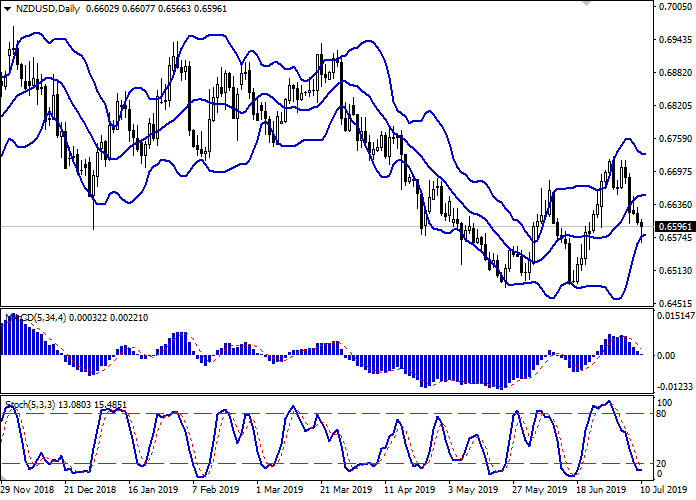
On the D1 chart, Bollinger Bands are reversing horizontally. The price range is also trying to consolidate within a wide flat channel. MACD is going down preserving a stable sell signal (being located under the signal line). Moreover, the indicator is trying to consolidate below the zero line at the moment. Stochastic tends to reverse horizontally, being located near its minima.
The showings of the indicators do not contradict the further development of the upward trend in the short and/or ultra-short term.
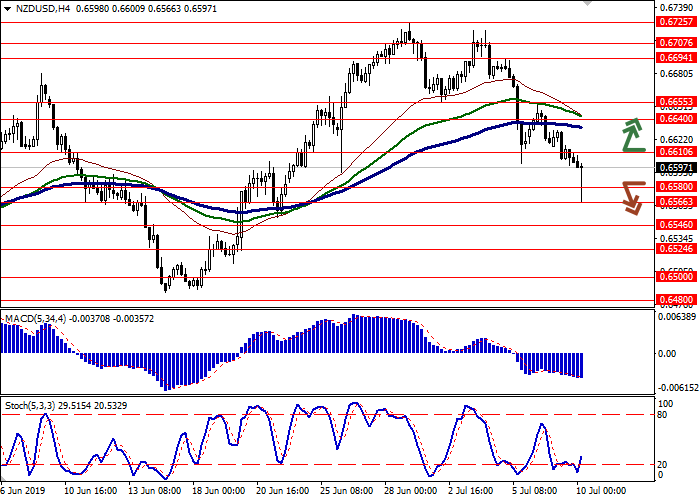
Resistance levels: 0.6610, 0.6640, 0.6655, 0.6694.
Support levels: 0.6580, 0.6566, 0.6546, 0.6524.


Trading tips
To open long positions, one can rely on the breakout of 0.6610. Take profit – 0.6680 or 0.6707. Stop loss – 0.6580.
A confident breakdown of 0.6580–0.6566 may serve as a signal to further sales with the target at 0.6500. Stop loss – 0.6600–0.6610.
Implementation period: 2-3 days.
The New Zealand dollar showed a moderate decline against the US one on Tuesday, continuing the development of the "bearish" impulse formed on July 4. USD is still strengthened by the labor market report published at the end of last week, which pleasantly surprised investors with a sharp increase in employment. Now the market awaits the upcoming July 10 speech by Fed Chairman Jerome Powell in Congress. It is expected that Powell can take a waiting position and will advocate keeping the rate unchanged at the July meeting of the regulator.
Today, the instrument is traded in both directions. The confident decline in the first hours was replaced by an active correction, which somewhat weakened the position of ultra-short "bears". Published New Zealand statistics was weak. The food price index in June showed a sharp decline of 0.7% MoM with an expected decline of only 0.3% MoM.
Support and resistance
On the D1 chart, Bollinger Bands are reversing horizontally. The price range is also trying to consolidate within a wide flat channel. MACD is going down preserving a stable sell signal (being located under the signal line). Moreover, the indicator is trying to consolidate below the zero line at the moment. Stochastic tends to reverse horizontally, being located near its minima.
The showings of the indicators do not contradict the further development of the upward trend in the short and/or ultra-short term.
Resistance levels: 0.6610, 0.6640, 0.6655, 0.6694.
Support levels: 0.6580, 0.6566, 0.6546, 0.6524.


Trading tips
To open long positions, one can rely on the breakout of 0.6610. Take profit – 0.6680 or 0.6707. Stop loss – 0.6580.
A confident breakdown of 0.6580–0.6566 may serve as a signal to further sales with the target at 0.6500. Stop loss – 0.6600–0.6610.
Implementation period: 2-3 days.


No comments:
Write comments