USD/CAD: the dollar remains under pressure
05 July 2019, 09:55
| Scenario | |
|---|---|
| Timeframe | Intraday |
| Recommendation | BUY STOP |
| Entry Point | 1.3105 |
| Take Profit | 1.3228, 1.3260, 1.3283 |
| Stop Loss | 1.3030 |
| Key Levels | 1.2967, 1.3000, 1.3036, 1.3100, 1.3149, 1.3200, 1.3228 |
| Alternative scenario | |
|---|---|
| Recommendation | SELL STOP |
| Entry Point | 1.3030 |
| Take Profit | 1.2950 |
| Stop Loss | 1.3080 |
| Key Levels | 1.2967, 1.3000, 1.3036, 1.3100, 1.3149, 1.3200, 1.3228 |
Current trend
Yesterday, USD declined slightly against CAD, renewing lows of October 25, 2018. US markets were closed due to the Independence Day, so traders responded to the previous drivers, as there was enough macroeconomic statistics. Investors were disappointed with US business statistics in June. The ISM Service PMI fell from 56.9 to 55.1 points, while it as expected to stay at the same level. Production Orders data were also negative. In May, the figure fell by 0.7% MoM after falling by 1.2% MoM last month. Analysts had expected a decline of 0.5% MoM.
Today, traders are awaiting the publication of reports on the labor markets of the United States and Canada. It is predicted that the level of employment in Canada in June will grow only by 10.0K against the previous dynamics of +27.7K. The unemployment rate may rise from 5.4% to 5.5%.
Support and resistance
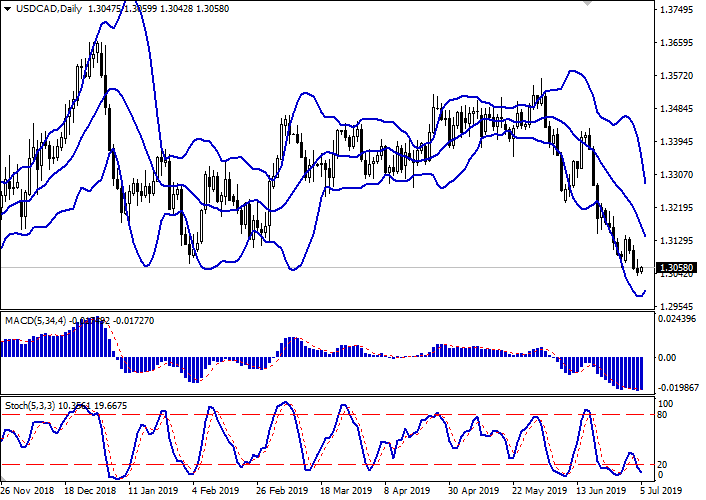
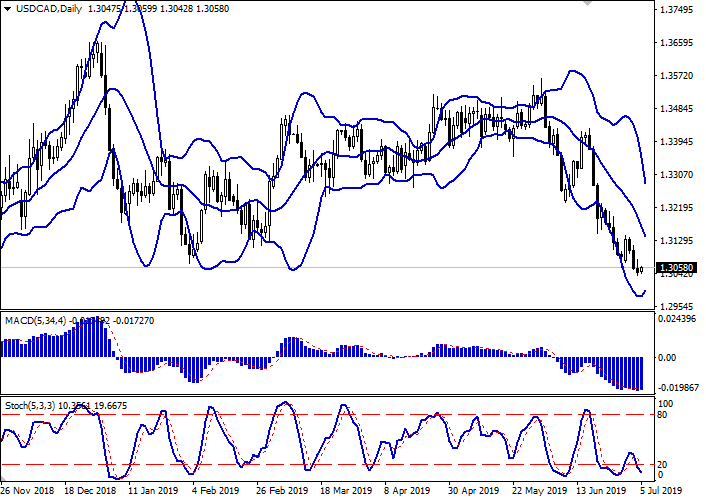
On the daily chart, Bollinger bands steadily decline. The price range is narrowed, reflecting the appearance of correctional dynamics in the short term. The MACD grows, keeping a poor buy signal (the histogram is above the signal line). Stochastic, which began to decline on Tuesday, is approaching the zero line, signaling that USD is oversold in the super-short term.
It is better to wait for additional technical signals of the upward reversal.
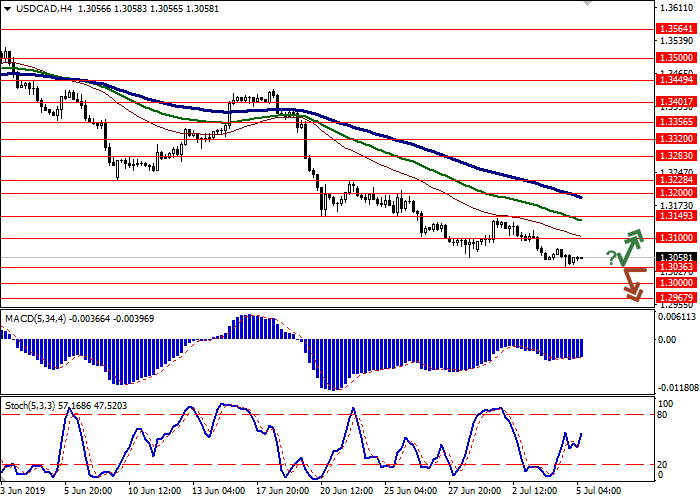
Resistance levels: 1.3100, 1.3149, 1.3200, 1.3228.
Support levels: 1.3036, 1.3000, 1.2967.


Trading tips
Long positions can be opened after a rebound from 1.3036 and the breakout of 1.3100 with the targets at 1.3228 or 1.3260–1.3283. Stop loss – 1.3030. Implementation period: 2–3 days.
Short positions can be opened after the breakdown of 1.3036 with the target at 1.2950. Stop loss – 1.3080. Implementation period: 1–2 days.
Yesterday, USD declined slightly against CAD, renewing lows of October 25, 2018. US markets were closed due to the Independence Day, so traders responded to the previous drivers, as there was enough macroeconomic statistics. Investors were disappointed with US business statistics in June. The ISM Service PMI fell from 56.9 to 55.1 points, while it as expected to stay at the same level. Production Orders data were also negative. In May, the figure fell by 0.7% MoM after falling by 1.2% MoM last month. Analysts had expected a decline of 0.5% MoM.
Today, traders are awaiting the publication of reports on the labor markets of the United States and Canada. It is predicted that the level of employment in Canada in June will grow only by 10.0K against the previous dynamics of +27.7K. The unemployment rate may rise from 5.4% to 5.5%.
Support and resistance
On the daily chart, Bollinger bands steadily decline. The price range is narrowed, reflecting the appearance of correctional dynamics in the short term. The MACD grows, keeping a poor buy signal (the histogram is above the signal line). Stochastic, which began to decline on Tuesday, is approaching the zero line, signaling that USD is oversold in the super-short term.
It is better to wait for additional technical signals of the upward reversal.
Resistance levels: 1.3100, 1.3149, 1.3200, 1.3228.
Support levels: 1.3036, 1.3000, 1.2967.


Trading tips
Long positions can be opened after a rebound from 1.3036 and the breakout of 1.3100 with the targets at 1.3228 or 1.3260–1.3283. Stop loss – 1.3030. Implementation period: 2–3 days.
Short positions can be opened after the breakdown of 1.3036 with the target at 1.2950. Stop loss – 1.3080. Implementation period: 1–2 days.


No comments:
Write comments