
GBP/USD: pound is adjusted
18 July 2019, 09:47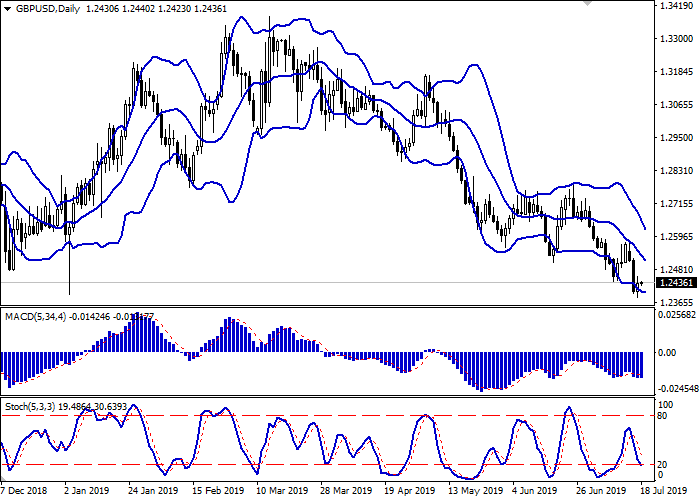
| Scenario | |
|---|---|
| Timeframe | Intraday |
| Recommendation | BUY STOP |
| Entry Point | 1.2480 |
| Take Profit | 1.2600 |
| Stop Loss | 1.2438, 1.2420 |
| Key Levels | 1.2300, 1.2334, 1.2380, 1.2400, 1.2438, 1.2476, 1.2504, 1.2533 |
| Alternative scenario | |
|---|---|
| Recommendation | SELL STOP |
| Entry Point | 1.2395, 1.2375 |
| Take Profit | 1.2300 |
| Stop Loss | 1.2438 |
| Key Levels | 1.2300, 1.2334, 1.2380, 1.2400, 1.2438, 1.2476, 1.2504, 1.2533 |
Current trend
Yesterday, the GBP/USD pair slightly increased, interrupting the development of a strong “bearish” impulse formed a day earlier. The growth of the instrument was largely due to technical factors, while the macroeconomic background from the UK remained moderately negative. On Wednesday, investors focused on consumer and industrial inflation data. In June, CPI on a monthly basis remained at the same level, slowing down from the previous growth of 0.3% MoM. In annual terms, inflation is at the target level of 2% YoY. The Producer Price Index for the same period decreased by 0.1% MoM and grew by 1.6% YoY, which was worse than analysts' expectations of growth by 0.1% MoM and 1.7% YoY.
Today, Retail Sales data will be released, as well as Q2 BOE Credit Conditions Survey.
Support and resistance
On the daily chart, Bollinger bands steadily decline. The price range narrows below, indicating the emergence of ambiguous trading dynamics in the short/super short term. The MACD tries to reverse upwards, keeping the same sell signal (the histogram is below the signal line). Stochastic is falling but is reaching its lows, which indicates that GBP may become oversold in the super short term.
It is better to keep current short positions until the formation of "bullish" signals from the technical indicators.
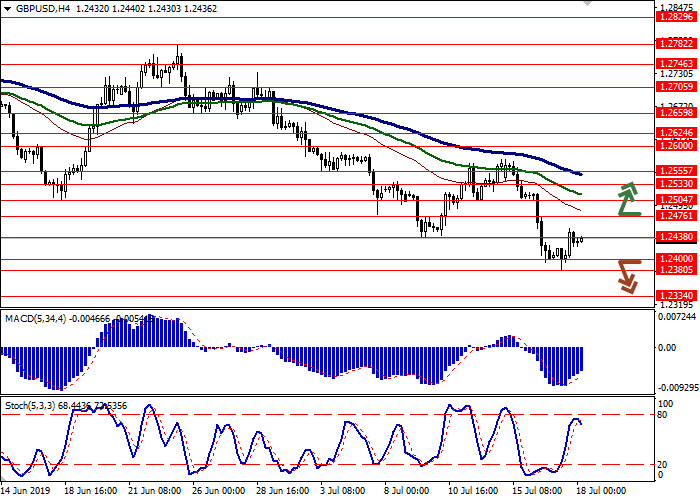
Resistance levels: 1.2438, 1.2476, 1.2504, 1.2533.
Support levels: 1.2400, 1.2380, 1.2334, 1.2300.

Trading tips
Long positions can be opened after the breakout of 1.2476 with the target at 1.2600. Stop loss is 1.2438–1.2420.
Short positions can be opened after the breakdown of 1.2400 or 1.2380 with the target at 1.2300. Stop loss is 1.2438.
Implementation period: 2–3 days.
Yesterday, the GBP/USD pair slightly increased, interrupting the development of a strong “bearish” impulse formed a day earlier. The growth of the instrument was largely due to technical factors, while the macroeconomic background from the UK remained moderately negative. On Wednesday, investors focused on consumer and industrial inflation data. In June, CPI on a monthly basis remained at the same level, slowing down from the previous growth of 0.3% MoM. In annual terms, inflation is at the target level of 2% YoY. The Producer Price Index for the same period decreased by 0.1% MoM and grew by 1.6% YoY, which was worse than analysts' expectations of growth by 0.1% MoM and 1.7% YoY.
Today, Retail Sales data will be released, as well as Q2 BOE Credit Conditions Survey.
Support and resistance
On the daily chart, Bollinger bands steadily decline. The price range narrows below, indicating the emergence of ambiguous trading dynamics in the short/super short term. The MACD tries to reverse upwards, keeping the same sell signal (the histogram is below the signal line). Stochastic is falling but is reaching its lows, which indicates that GBP may become oversold in the super short term.
It is better to keep current short positions until the formation of "bullish" signals from the technical indicators.
Resistance levels: 1.2438, 1.2476, 1.2504, 1.2533.
Support levels: 1.2400, 1.2380, 1.2334, 1.2300.
Trading tips
Long positions can be opened after the breakout of 1.2476 with the target at 1.2600. Stop loss is 1.2438–1.2420.
Short positions can be opened after the breakdown of 1.2400 or 1.2380 with the target at 1.2300. Stop loss is 1.2438.
Implementation period: 2–3 days.


No comments:
Write comments