
USD/CAD: the pair falls
18 July 2019, 09:34
| Scenario | |
|---|---|
| Timeframe | Intraday |
| Recommendation | BUY STOP |
| Entry Point | 1.3105 |
| Take Profit | 1.3200, 1.3228, 1.3250, 1.3260 |
| Stop Loss | 1.3050, 1.3040 |
| Key Levels | 1.2920, 1.2967, 1.3000, 1.3016, 1.3058, 1.3100, 1.3149, 1.3200 |
| Alternative scenario | |
|---|---|
| Recommendation | SELL STOP |
| Entry Point | 1.3010, 1.2995 |
| Take Profit | 1.2920, 1.2900 |
| Stop Loss | 1.3058 |
| Key Levels | 1.2920, 1.2967, 1.3000, 1.3016, 1.3058, 1.3100, 1.3149, 1.3200 |
Current trend
Yesterday, the USD/CAD pair fell, offsetting the results of corrective growth at the beginning of the week. The negative dynamics was due to the ambiguous US housing market data. Thus, June’s Housing Starts index decreased by 0.9% MoM after a decrease of 0.4% MoM last month. June’s number of Building Permits decreased by 6.1% MoM after rising by 0.7% MoM in May.
However, data from Canada also turned out to be worse than market expectations. In June, the Core CPI from the Bank of Canada slowed down from +2.1% to +2.0% YoY, while analysts expected the figure to rise to 2.6% YoY. In monthly terms, the index did not change after rising by 0.4% MoM in May. The volume of industrial supplies in May rose by 1.6% MoM after a decrease of 0.4% MoM last month. Analysts had expected growth in shipments of 2.0% MoM.
Support and resistance
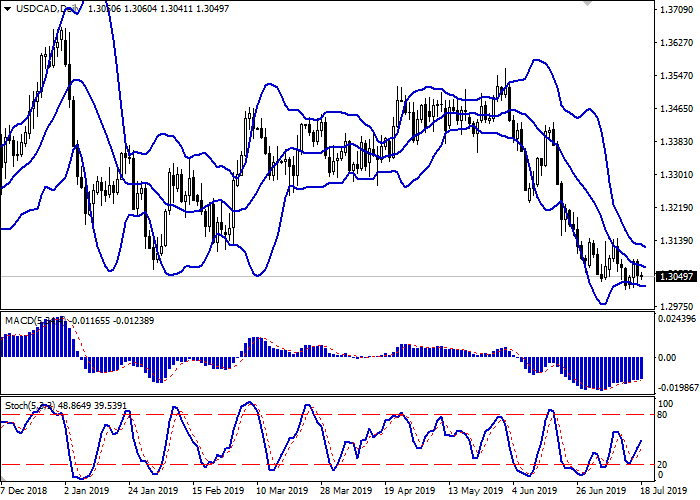
On the daily chart, Bollinger bands moderately fell. The price range narrows slightly, reflecting the ambiguous trading nature in the short term. The MACD slightly grows, keeping a buy signal (the histogram is above the signal line). Stochastic grows in the center of its working area.
To open new trading positions, it is better to wait until the situation is clear.
Resistance levels: 1.3058, 1.3100, 1.3149, 1.3200.
Support levels: 1.3016, 1.3000, 1.2967, 1.2920.

Trading tips
Long positions can be opened after the breakout of 1.3100 with the targets at 1.3200–1.3228 or 1.3250–1.3260. Stop loss is 1.3050–1.3040.
Short positions can be opened after the breakdown of 1.3016–1.3000 with the targets at 1.2920–1.2900. Stop loss is 1.3058.
Implementation period: 2–3 days.
Yesterday, the USD/CAD pair fell, offsetting the results of corrective growth at the beginning of the week. The negative dynamics was due to the ambiguous US housing market data. Thus, June’s Housing Starts index decreased by 0.9% MoM after a decrease of 0.4% MoM last month. June’s number of Building Permits decreased by 6.1% MoM after rising by 0.7% MoM in May.
However, data from Canada also turned out to be worse than market expectations. In June, the Core CPI from the Bank of Canada slowed down from +2.1% to +2.0% YoY, while analysts expected the figure to rise to 2.6% YoY. In monthly terms, the index did not change after rising by 0.4% MoM in May. The volume of industrial supplies in May rose by 1.6% MoM after a decrease of 0.4% MoM last month. Analysts had expected growth in shipments of 2.0% MoM.
Support and resistance
On the daily chart, Bollinger bands moderately fell. The price range narrows slightly, reflecting the ambiguous trading nature in the short term. The MACD slightly grows, keeping a buy signal (the histogram is above the signal line). Stochastic grows in the center of its working area.
To open new trading positions, it is better to wait until the situation is clear.
Resistance levels: 1.3058, 1.3100, 1.3149, 1.3200.
Support levels: 1.3016, 1.3000, 1.2967, 1.2920.
Trading tips
Long positions can be opened after the breakout of 1.3100 with the targets at 1.3200–1.3228 or 1.3250–1.3260. Stop loss is 1.3050–1.3040.
Short positions can be opened after the breakdown of 1.3016–1.3000 with the targets at 1.2920–1.2900. Stop loss is 1.3058.
Implementation period: 2–3 days.


No comments:
Write comments