GBP/USD: the downward trend will continue
01 July 2019, 14:34
| Scenario | |
|---|---|
| Timeframe | Weekly |
| Recommendation | SELL |
| Entry Point | 1.2644 |
| Take Profit | 1.2500 |
| Stop Loss | 1.2710 |
| Key Levels | 1.2330, 1.2350, 1.2400, 1.2500, 1.2600, 1.2655, 1.2760, 1.2785, 1.2865, 1.2960, 1.3000, 1.3070 |
| Alternative scenario | |
|---|---|
| Recommendation | SELL LIMIT |
| Entry Point | 1.2865, 1.2960 |
| Take Profit | 1.2500 |
| Stop Loss | 1.3010 |
| Key Levels | 1.2330, 1.2350, 1.2400, 1.2500, 1.2600, 1.2655, 1.2760, 1.2785, 1.2865, 1.2960, 1.3000, 1.3070 |
Current trend
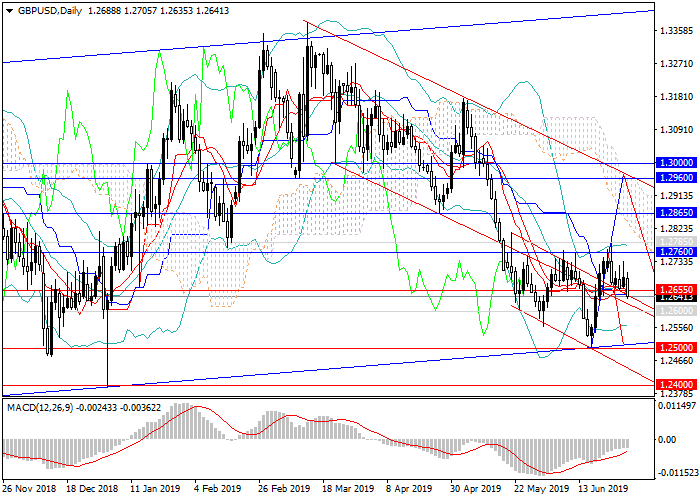
At the beginning of the last trading week, the GBP/USD pair tested a new maximum at the level of 1.2785, failed to consolidate on it and went downwards. Today, the downward momentum has intensified, and the price retests the border of the medium-term downward channel. The main catalysts for the fall were trading sentiment and the fundamental background. Investors do not believe in the British currency due to the political crisis in the UK, and the country's key economic indicators are declining, which indicates a weakening of the growth rate of the economy as a whole.
Basic data that can significantly affect the course will be published at the end of the current trading week: UK major indices will be released, and data on the labor market and production orders will be published in the United States.
Support and resistance
In mid-June, the pair reversed downwards. Now the price is out of the narrow downward channel but on the way it has key resistance levels that will be difficult to overcome with poor macroeconomic data. Thus, longer corrections to the levels of 1.2865, 1.2960 are possible but the downward trend will continue.
Technical indicators confirm the forecast of a further decline: high volumes of short MACD positions remain on the daily chart and above, while Bollinger bands are pointing downwards.
Resistance levels: 1.2760, 1.2785, 1.2865, 1.2960, 1.3000, 1.3070.
Support levels: 1.2655, 1.2600, 1.2500, 1.2400, 1.2350, 1.2330.

Trading tips
Short positions can be opened from the current level and pending short positions can be opened from the levels of 1.2865, 1.2960 with the target at 1.2500 and stop loss 1.3010.
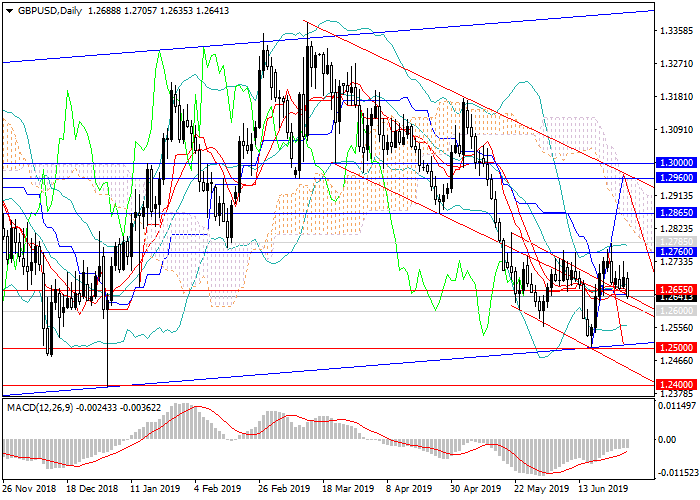
At the beginning of the last trading week, the GBP/USD pair tested a new maximum at the level of 1.2785, failed to consolidate on it and went downwards. Today, the downward momentum has intensified, and the price retests the border of the medium-term downward channel. The main catalysts for the fall were trading sentiment and the fundamental background. Investors do not believe in the British currency due to the political crisis in the UK, and the country's key economic indicators are declining, which indicates a weakening of the growth rate of the economy as a whole.
Basic data that can significantly affect the course will be published at the end of the current trading week: UK major indices will be released, and data on the labor market and production orders will be published in the United States.
Support and resistance
In mid-June, the pair reversed downwards. Now the price is out of the narrow downward channel but on the way it has key resistance levels that will be difficult to overcome with poor macroeconomic data. Thus, longer corrections to the levels of 1.2865, 1.2960 are possible but the downward trend will continue.
Technical indicators confirm the forecast of a further decline: high volumes of short MACD positions remain on the daily chart and above, while Bollinger bands are pointing downwards.
Resistance levels: 1.2760, 1.2785, 1.2865, 1.2960, 1.3000, 1.3070.
Support levels: 1.2655, 1.2600, 1.2500, 1.2400, 1.2350, 1.2330.

Trading tips
Short positions can be opened from the current level and pending short positions can be opened from the levels of 1.2865, 1.2960 with the target at 1.2500 and stop loss 1.3010.


No comments:
Write comments