EUR/USD: the euro is growing
12 July 2019, 09:58
| Scenario | |
|---|---|
| Timeframe | Intraday |
| Recommendation | BUY STOP |
| Entry Point | 1.1290 |
| Take Profit | 1.1343, 1.1370 |
| Stop Loss | 1.1255 |
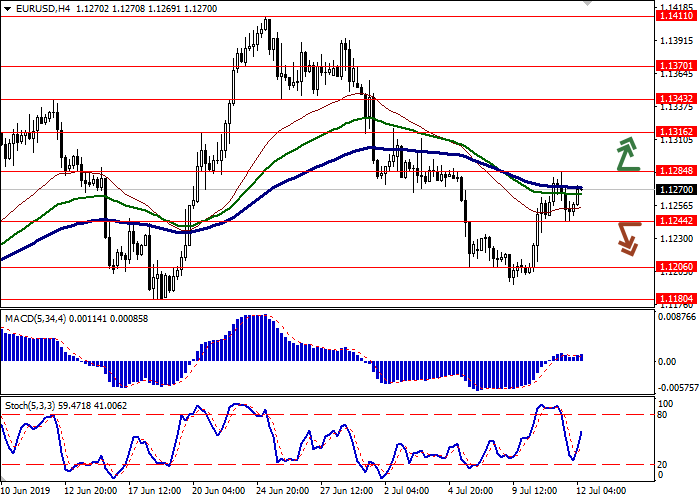
| Key Levels | 1.1180, 1.1206, 1.1244, 1.1284, 1.1316, 1.1343, 1.1370 |
| Alternative scenario | |
|---|---|
| Recommendation | SELL STOP |
| Entry Point | 1.1240 |
| Take Profit | 1.1180 |
| Stop Loss | 1.1270 |
| Key Levels | 1.1180, 1.1206, 1.1244, 1.1284, 1.1316, 1.1343, 1.1370 |
Current trend
EUR showed ambiguous dynamics against USD yesterday, having managed to update the local maxima of July 5. EUR was supported by German macroeconomic statistics. The harmonized CPI in June rose by 0.3% MoM after rising by 0.1% in May. It increased by 1.5% YoY, which also turned out to be better than market expectations of 1.3%. Information about the ECB meeting on monetary policy of 5-6 June, which was also published yesterday, put moderate pressure on the euro. The protocols reflected the revision of the Eurozone GDP for 2019 up to 1.2% YoY. However, for 2020 and 2021, GDP forecasts were revised down to 1.4% YoY. The regulator also expects current interest rates to remain unchanged at least until the first half of 2020.
Today, investors are focused on the May statistics on industrial output in the Eurozone.
Support and resistance
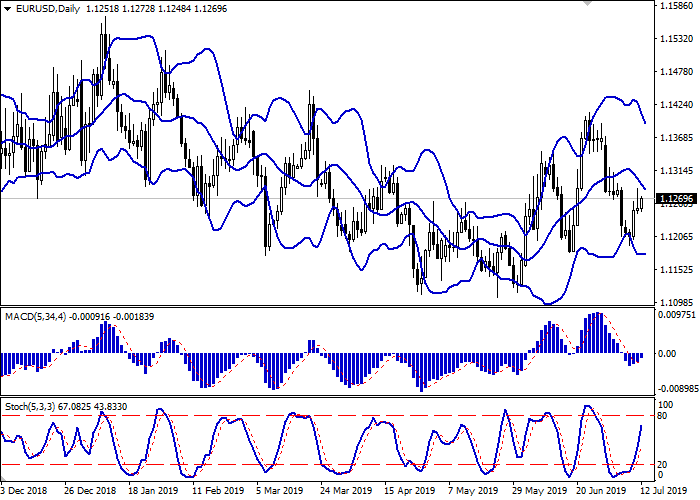
Bollinger Bands in D1 chart demonstrate a gradual decrease. The price range is narrowing, reflecting the ambiguous dynamics of trading in the short term. MACD indicator is growing preserving a stable buy signal (the histogram is above the signal line). In addition, the indicator is currently preparing to test the zero level. Stochastic keeps a confident upward trend but is located near its maximum levels, signaling the overbought euro in the ultra-short term.
The showings of the indicators do not contradict the further development of the "bullish" trend in the short and/or ultra-short term.
Resistance levels: 1.1284, 1.1316, 1.1343, 1.1370.
Support levels: 1.1244, 1.1206, 1.1180.


Trading tips
To open long positions, one can rely on the breakout of 1.1284. Take profit – 1.1343 or 1.1370. Stop loss – 1.1255.
A confident breakdown of 1.1244 may serve as a signal to further sales with the target at 1.1180. Stop loss – 1.1270.
Implementation period: 2-3 days.
EUR showed ambiguous dynamics against USD yesterday, having managed to update the local maxima of July 5. EUR was supported by German macroeconomic statistics. The harmonized CPI in June rose by 0.3% MoM after rising by 0.1% in May. It increased by 1.5% YoY, which also turned out to be better than market expectations of 1.3%. Information about the ECB meeting on monetary policy of 5-6 June, which was also published yesterday, put moderate pressure on the euro. The protocols reflected the revision of the Eurozone GDP for 2019 up to 1.2% YoY. However, for 2020 and 2021, GDP forecasts were revised down to 1.4% YoY. The regulator also expects current interest rates to remain unchanged at least until the first half of 2020.
Today, investors are focused on the May statistics on industrial output in the Eurozone.
Support and resistance
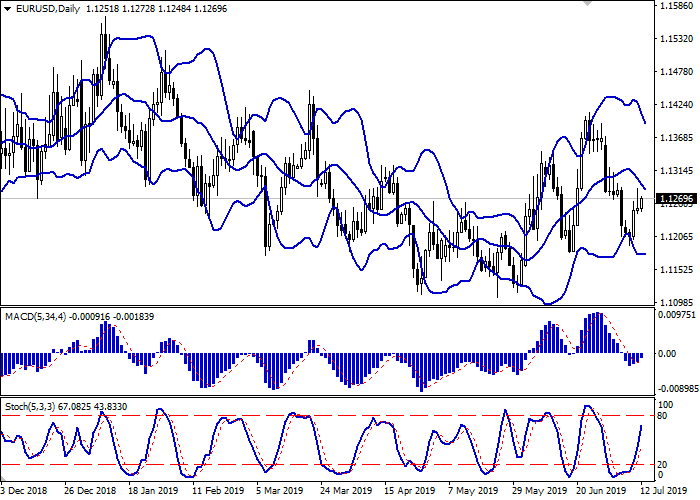
Bollinger Bands in D1 chart demonstrate a gradual decrease. The price range is narrowing, reflecting the ambiguous dynamics of trading in the short term. MACD indicator is growing preserving a stable buy signal (the histogram is above the signal line). In addition, the indicator is currently preparing to test the zero level. Stochastic keeps a confident upward trend but is located near its maximum levels, signaling the overbought euro in the ultra-short term.
The showings of the indicators do not contradict the further development of the "bullish" trend in the short and/or ultra-short term.
Resistance levels: 1.1284, 1.1316, 1.1343, 1.1370.
Support levels: 1.1244, 1.1206, 1.1180.


Trading tips
To open long positions, one can rely on the breakout of 1.1284. Take profit – 1.1343 or 1.1370. Stop loss – 1.1255.
A confident breakdown of 1.1244 may serve as a signal to further sales with the target at 1.1180. Stop loss – 1.1270.
Implementation period: 2-3 days.


No comments:
Write comments