USD/CHF: instrument consolidated
12 July 2019, 10:20
| Scenario | |
|---|---|
| Timeframe | Intraday |
| Recommendation | BUY STOP |
| Entry Point | 0.9910 |
| Take Profit | 1.0000, 1.0020 |
| Stop Loss | 0.9860 |
| Key Levels | 0.9775, 0.9800, 0.9833, 0.9860, 0.9907, 0.9930, 0.9960, 1.0000 |
| Alternative scenario | |
|---|---|
| Recommendation | SELL STOP |
| Entry Point | 0.9855 |
| Take Profit | 0.9800, 0.9775 |
| Stop Loss | 0.9890 |
| Key Levels | 0.9775, 0.9800, 0.9833, 0.9860, 0.9907, 0.9930, 0.9960, 1.0000 |
Current trend
Yesterday, USD fell steadily against CHF, renewing the lows since July 5. However, it could not consolidate on the new levels, and by the end of the daily session, USD was able to go into the green zone. The US currency was supported by strong data on consumer inflation, which contributed to an increase in the probability of the Fed keeping the interest rates unchanged during the July regulator meeting. The Initial Jobless Claims data also had a positive impact on the USD. During the week of July 5, its number decreased from 222K to 209K, which was significantly better than investors' forecasts of 223K. The number of secondary applications (as of June 28) also decreased significantly from 222,500 to 219,250 against the forecast of 223,426.
Support and resistance
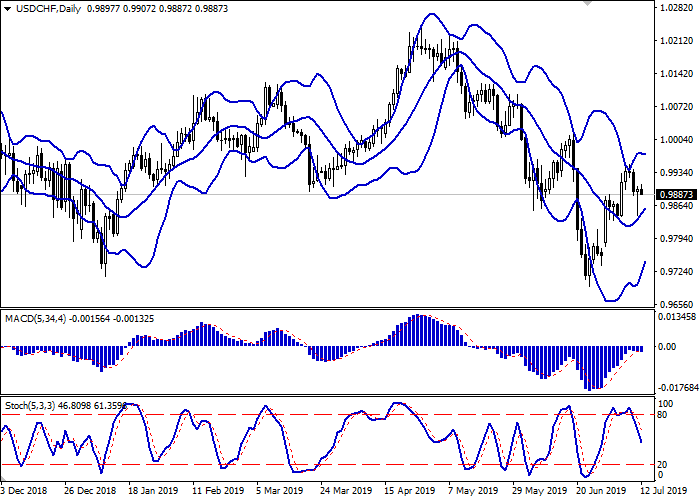
Bollinger bands grow steadily on the daily chart. The price range narrows from above, reflecting the emergence of multidirectional dynamics in the short/extra short term. The MACD tries to reverse downwards and form a new sell signal (the histogram should be located below the signal line). Stochastic is falling more confidently, reflecting enough potential for the development of a downtrend in the super-short term.
The formation of a full-fledged “bearish” trend in the short and/or super short term is possible.
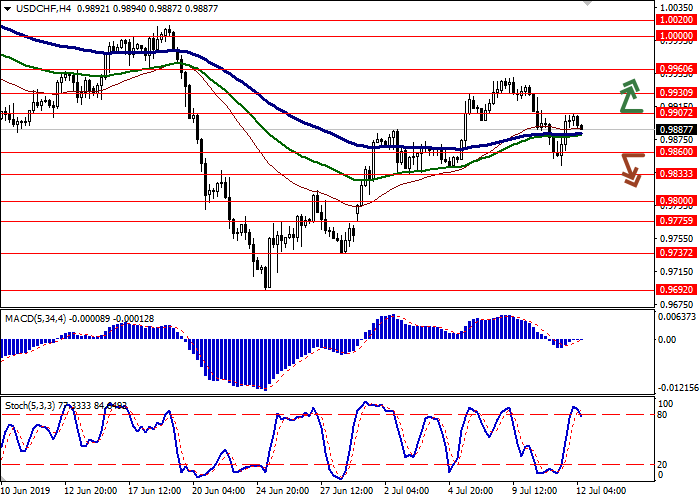
Resistance levels: 0.9907, 0.9930, 0.9960, 1.0000.
Support levels: 0.9860, 0.9833, 0.9800, 0.9775.


Trading tips
Long positions can be opened after the breakout of 0.9907 with the target at 1.0000 or 1.0020. Stop loss is 0.9860.
Short positions can be opened after the breakdown of 0.9860 with the target at 0.9800 or 0.9775. Stop loss is 0.9890.
Implementation period: 2–3 days.
Yesterday, USD fell steadily against CHF, renewing the lows since July 5. However, it could not consolidate on the new levels, and by the end of the daily session, USD was able to go into the green zone. The US currency was supported by strong data on consumer inflation, which contributed to an increase in the probability of the Fed keeping the interest rates unchanged during the July regulator meeting. The Initial Jobless Claims data also had a positive impact on the USD. During the week of July 5, its number decreased from 222K to 209K, which was significantly better than investors' forecasts of 223K. The number of secondary applications (as of June 28) also decreased significantly from 222,500 to 219,250 against the forecast of 223,426.
Support and resistance
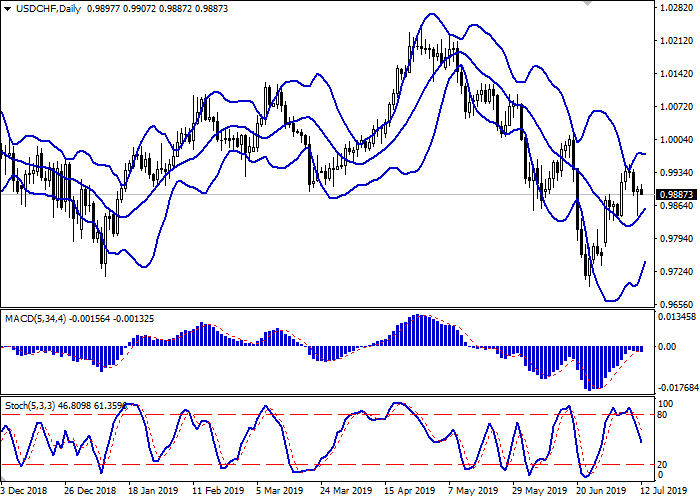
Bollinger bands grow steadily on the daily chart. The price range narrows from above, reflecting the emergence of multidirectional dynamics in the short/extra short term. The MACD tries to reverse downwards and form a new sell signal (the histogram should be located below the signal line). Stochastic is falling more confidently, reflecting enough potential for the development of a downtrend in the super-short term.
The formation of a full-fledged “bearish” trend in the short and/or super short term is possible.
Resistance levels: 0.9907, 0.9930, 0.9960, 1.0000.
Support levels: 0.9860, 0.9833, 0.9800, 0.9775.


Trading tips
Long positions can be opened after the breakout of 0.9907 with the target at 1.0000 or 1.0020. Stop loss is 0.9860.
Short positions can be opened after the breakdown of 0.9860 with the target at 0.9800 or 0.9775. Stop loss is 0.9890.
Implementation period: 2–3 days.


No comments:
Write comments