
Brent Crude Oil: prices are consolidating
25 July 2019, 09:44
| Scenario | |
|---|---|
| Timeframe | Intraday |
| Recommendation | BUY STOP |
| Entry Point | 64.05 |
| Take Profit | 66.68 |
| Stop Loss | 63.00 |
| Key Levels | 60.64, 61.51, 62.67, 64.00, 64.73, 65.24, 65.98 |
| Alternative scenario | |
|---|---|
| Recommendation | SELL STOP |
| Entry Point | 62.60 |
| Take Profit | 60.64 |
| Stop Loss | 63.50 |
| Key Levels | 60.64, 61.51, 62.67, 64.00, 64.73, 65.24, 65.98 |
Current trend
Oil prices showed a decline July 24, despite the fact that during the day the instrument showed a moderate increase. Confident support for the quotes was provided by the EIA oil reserves report. For the week of July 19, oil and petroleum products in the United States fell sharply by 10.835 million barrels after a decrease of 3.116 million over the previous period. Analysts expected a decrease of −4.011 million. The EIA report almost completely coincided with the API data that appeared the day before. The report also reflected the decline in oil production in the USA from 12.000 million to 11.300 million barrels per day. Additional price support is provided by the continuing tension in the Middle East.
Support and resistance
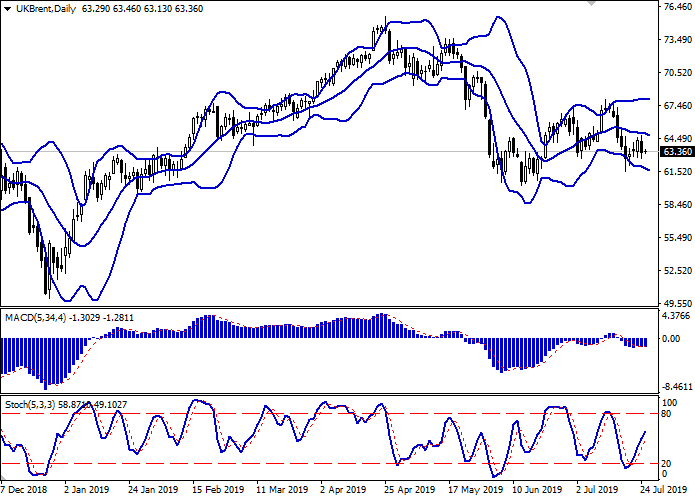
Bollinger Bands in D1 chart demonstrate a gradual decrease. The price range is narrowed from below, remaining rather spacious, given the current level of activity in the market. MACD is going down preserving a weak sell signal (being located under the signal line). Stochastic, on the contrary, maintains quite active growth and practically does not react to the appearance of downward dynamics on Wednesday.
To open new positions, one should wait for the clarification of signals from technical indicators.
Resistance levels: 64.00, 64.73, 65.24, 65.98.
Support levels: 62.67, 61.51, 60.64.

Trading tips
To open long positions, one can rely on the breakout of 64.00. Take-profit – 66.68. Stop loss – 63.00.
A confident breakdown of 62.67 may serve as a signal to further sales with the target at 60.64. Stop loss – 63.50.
Implementation period: 2-3 days.
Oil prices showed a decline July 24, despite the fact that during the day the instrument showed a moderate increase. Confident support for the quotes was provided by the EIA oil reserves report. For the week of July 19, oil and petroleum products in the United States fell sharply by 10.835 million barrels after a decrease of 3.116 million over the previous period. Analysts expected a decrease of −4.011 million. The EIA report almost completely coincided with the API data that appeared the day before. The report also reflected the decline in oil production in the USA from 12.000 million to 11.300 million barrels per day. Additional price support is provided by the continuing tension in the Middle East.
Support and resistance
Bollinger Bands in D1 chart demonstrate a gradual decrease. The price range is narrowed from below, remaining rather spacious, given the current level of activity in the market. MACD is going down preserving a weak sell signal (being located under the signal line). Stochastic, on the contrary, maintains quite active growth and practically does not react to the appearance of downward dynamics on Wednesday.
To open new positions, one should wait for the clarification of signals from technical indicators.
Resistance levels: 64.00, 64.73, 65.24, 65.98.
Support levels: 62.67, 61.51, 60.64.
Trading tips
To open long positions, one can rely on the breakout of 64.00. Take-profit – 66.68. Stop loss – 63.00.
A confident breakdown of 62.67 may serve as a signal to further sales with the target at 60.64. Stop loss – 63.50.
Implementation period: 2-3 days.


No comments:
Write comments