
XAG/USD: silver prices are rising
25 July 2019, 09:45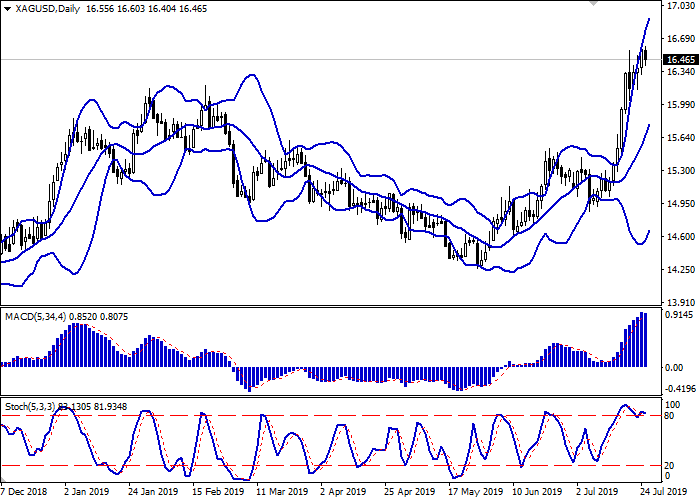
| Scenario | |
|---|---|
| Timeframe | Intraday |
| Recommendation | BUY STOP |
| Entry Point | 16.65 |
| Take Profit | 17.00 |
| Stop Loss | 16.40 |
| Key Levels | 15.84, 16.03, 16.18, 16.40, 16.62, 16.82, 17.00 |
| Alternative scenario | |
|---|---|
| Recommendation | SELL STOP |
| Entry Point | 16.27, 16.15 |
| Take Profit | 15.84, 15.67, 15.52 |
| Stop Loss | 16.40, 16.50 |
| Key Levels | 15.84, 16.03, 16.18, 16.40, 16.62, 16.82, 17.00 |
Current trend
Yesterday, silver prices rose markedly, renewing record highs since June 15, 2018, due to the market expectations of a new cycle of monetary policy easing by the world's leading central banks. The ECB meeting will take place today, and the FED meeting will be held July 30–31. Unlike the Fed, the European regulator is not expected to reduce the rate at the June meeting but the officials’ comments and the general mood of the bank will be important. The ECB has repeatedly spoken in favor of new easing for the economy, so there is no reason to believe that this time the rhetoric will differ. Silver is also supported by poor US macroeconomic statistics. Yesterday, investors were disappointed by data on business activity, which did not reach the forecasts of analysts.
On Thursday, June Durable Goods Orders will be released.
Support and resistance
Bollinger bands grow steadily on the daily chart. The price range expands, remaining overly spacious for current market activity. The MACD tries to reverse into a downward plane, keeping the buy signal (the histogram is above the signal line). Stochastic slightly retreated from highs and reversed into a horizontal plane, reflecting that the instrument is overbought in the super-short and short term.
The development of large downward correctional dynamics is possible.
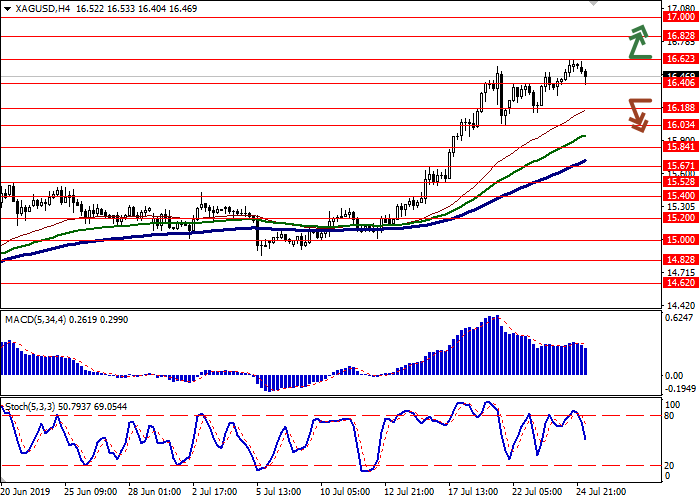
Resistance levels: 16.62, 16.82, 17.00.
Support levels: 16.40, 16.18, 16.03, 15.84.

Trading tips
Long positions can be opened after the breakout of 16.62 with the target at 17.00. Stop loss is 16.40. Implementation period: 1–2 days.
Short positions can be opened after the breakdown of 16.30–16.18 with the targets at 15.84 or 15.67–15.52. Stop loss is 16.40–16.50. Implementation period: 2–3 days.
Yesterday, silver prices rose markedly, renewing record highs since June 15, 2018, due to the market expectations of a new cycle of monetary policy easing by the world's leading central banks. The ECB meeting will take place today, and the FED meeting will be held July 30–31. Unlike the Fed, the European regulator is not expected to reduce the rate at the June meeting but the officials’ comments and the general mood of the bank will be important. The ECB has repeatedly spoken in favor of new easing for the economy, so there is no reason to believe that this time the rhetoric will differ. Silver is also supported by poor US macroeconomic statistics. Yesterday, investors were disappointed by data on business activity, which did not reach the forecasts of analysts.
On Thursday, June Durable Goods Orders will be released.
Support and resistance
Bollinger bands grow steadily on the daily chart. The price range expands, remaining overly spacious for current market activity. The MACD tries to reverse into a downward plane, keeping the buy signal (the histogram is above the signal line). Stochastic slightly retreated from highs and reversed into a horizontal plane, reflecting that the instrument is overbought in the super-short and short term.
The development of large downward correctional dynamics is possible.
Resistance levels: 16.62, 16.82, 17.00.
Support levels: 16.40, 16.18, 16.03, 15.84.
Trading tips
Long positions can be opened after the breakout of 16.62 with the target at 17.00. Stop loss is 16.40. Implementation period: 1–2 days.
Short positions can be opened after the breakdown of 16.30–16.18 with the targets at 15.84 or 15.67–15.52. Stop loss is 16.40–16.50. Implementation period: 2–3 days.


No comments:
Write comments