AUD/USD: the instrument is pressured
09 July 2019, 09:55
| Scenario | |
|---|---|
| Timeframe | Intraday |
| Recommendation | BUY STOP |
| Entry Point | 0.6980 |
| Take Profit | 0.7021, 0.7033 |
| Stop Loss | 0.6940 |
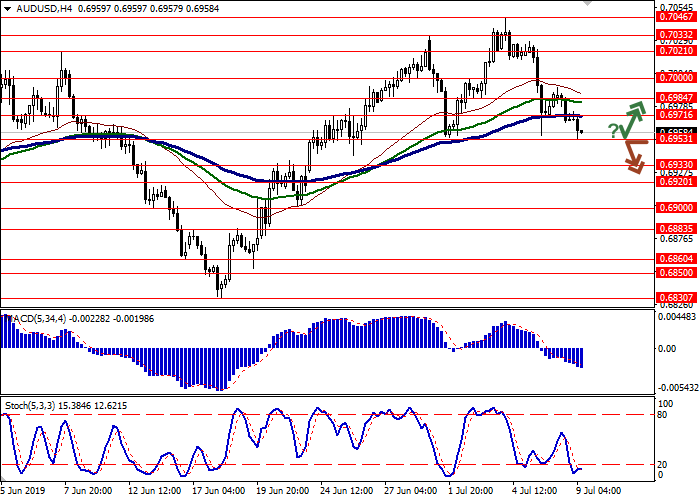
| Key Levels | 0.6900, 0.6920, 0.6933, 0.6953, 0.6971, 0.6984, 0.7000, 0.7021 |
| Alternative scenario | |
|---|---|
| Recommendation | SELL |
| Entry Point | 0.6952 |
| Take Profit | 0.6900, 0.6883 |
| Stop Loss | 0.6980 |
| Key Levels | 0.6900, 0.6920, 0.6933, 0.6953, 0.6971, 0.6984, 0.7000, 0.7021 |
Current trend
AUD tried the corrective growth against USD yesterday but returned to the downward trend. Investors are still focused on the June report on the US labor market, which has noticeably confused the Fed’s plans to ease monetary policy. The instrument is also pressured by the US-China trade negotiations, which may end with the signing of a final agreement.
Today, investors are focused on business sentiment statistics from the National Australia Bank. The NAB index of business confidence in June fell sharply from 7 to 2 points, which, however, was not surprising. The index of business conditions for the same period increased from 1 to 3 points, which also coincided with market expectations.
Support and resistance
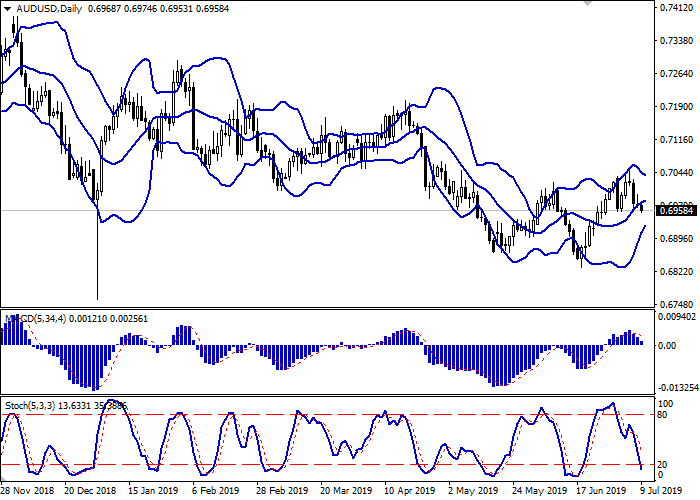
On the D1 chart, the Bollinger Bands are gradually reversing horizontally. The price range is narrowing, reflecting the ambiguous dynamics of trading in the short term. MACD is going down preserving a moderate sell signal (being located under the signal line). Also, the indicator is preparing to test the zero line on the breakdown. Stochastic keeps a confident downward direction but is nearing its minima, indicating the risks of the oversold AUD in the ultra-short term.
One should wait for the clarification of the signals from the indicators and of the situation on the market. Some of the short positions should be kept for some time.
Resistance levels: 0.6971, 0.6984, 0.7000, 0.7021.
Support levels: 0.6953, 0.6933, 0.6920, 0.6900.


Trading tips
Long positions may be opened if the price moves away from 0.69530, as from support, followed by the breakout of 0.6971. Take profit – 0.7021 or 0.7033. Stop loss – 0.6940.
A confident breakdown of 0.6953 may serve as a signal to further sales with the target at 0.6900 or 0.6883. Stop loss – 0.6980.
Implementation period: 2-3 days.
AUD tried the corrective growth against USD yesterday but returned to the downward trend. Investors are still focused on the June report on the US labor market, which has noticeably confused the Fed’s plans to ease monetary policy. The instrument is also pressured by the US-China trade negotiations, which may end with the signing of a final agreement.
Today, investors are focused on business sentiment statistics from the National Australia Bank. The NAB index of business confidence in June fell sharply from 7 to 2 points, which, however, was not surprising. The index of business conditions for the same period increased from 1 to 3 points, which also coincided with market expectations.
Support and resistance
On the D1 chart, the Bollinger Bands are gradually reversing horizontally. The price range is narrowing, reflecting the ambiguous dynamics of trading in the short term. MACD is going down preserving a moderate sell signal (being located under the signal line). Also, the indicator is preparing to test the zero line on the breakdown. Stochastic keeps a confident downward direction but is nearing its minima, indicating the risks of the oversold AUD in the ultra-short term.
One should wait for the clarification of the signals from the indicators and of the situation on the market. Some of the short positions should be kept for some time.
Resistance levels: 0.6971, 0.6984, 0.7000, 0.7021.
Support levels: 0.6953, 0.6933, 0.6920, 0.6900.


Trading tips
Long positions may be opened if the price moves away from 0.69530, as from support, followed by the breakout of 0.6971. Take profit – 0.7021 or 0.7033. Stop loss – 0.6940.
A confident breakdown of 0.6953 may serve as a signal to further sales with the target at 0.6900 or 0.6883. Stop loss – 0.6980.
Implementation period: 2-3 days.


No comments:
Write comments