Brent Crude Oil: oil prices are consolidating
09 July 2019, 09:28
| Scenario | |
|---|---|
| Timeframe | Intraday |
| Recommendation | BUY STOP |
| Entry Point | 64.80, 65.30 |
| Take Profit | 66.79, 67.38 |
| Stop Loss | 64.40, 64.00 |
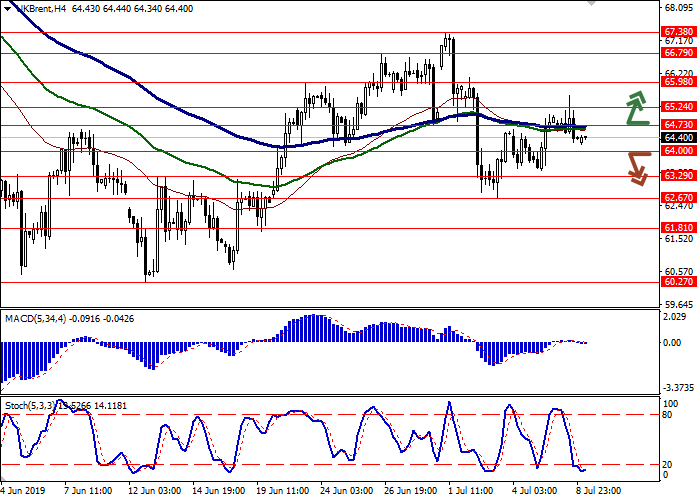
| Key Levels | 60.27, 61.81, 62.67, 63.29, 64.00, 64.73, 65.24, 65.98, 66.79 |
| Alternative scenario | |
|---|---|
| Recommendation | SELL STOP |
| Entry Point | 63.95 |
| Take Profit | 62.67, 61.81 |
| Stop Loss | 64.73 |
| Key Levels | 60.27, 61.81, 62.67, 63.29, 64.00, 64.73, 65.24, 65.98, 66.79 |
Current trend
Oil prices showed a moderate increase yesterday, but could not stay at the updated highs and returned to the red zone by the end of the day session. Quotes are supported by the growth of tension around Iran, as well as the lack of progress in the US-China trade negotiations. On Monday, Iran threatened to resume work on the enrichment of uranium, which was suspended under the 2015 agreement. Because of the US sanctions, Iran has actually lost all the benefits that it received as part of the agreement. It is likely that the resumption of nuclear activities will lead to a new deterioration of relations between Washington and Tehran. Today, investors will focus on the API report on oil reserves. The previous report reflected a sharp reduction by 5 million barrels, which was later not confirmed by the official report from the EIA.
Support and resistance
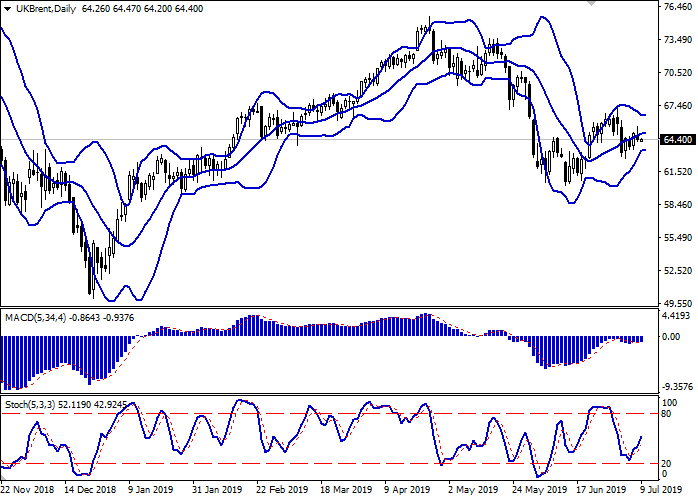
Bollinger Bands in the D1 chart demonstrate flat dynamics. The price range is trying to fix, reflecting the ambiguous dynamics of trading in the short term. MACD indicator is growing preserving a weak buy signal (histogram is above the signal line). Stochastic is showing a more confident growth and is located in the middle of its area.
The showings of the indicators do not contradict the possibility of further growth of the instrument in the short and/or ultra-short term.
Resistance levels: 64.73, 65.24, 65.98, 66.79.
Support levels: 64.00, 63.29, 62.67, 61.81, 60.27.


Trading tips
To open long positions, one can rely on the breakout of 64.73 or 65.24. Take profit – 66.79 or 67.38. Stop loss – 64.40–64.00.
A confident breakdown of 64.00 may serve as a signal for sales with the target at 62.67 or 61.81. Stop loss – 64.73.
Implementation period: 2-3 days.
Oil prices showed a moderate increase yesterday, but could not stay at the updated highs and returned to the red zone by the end of the day session. Quotes are supported by the growth of tension around Iran, as well as the lack of progress in the US-China trade negotiations. On Monday, Iran threatened to resume work on the enrichment of uranium, which was suspended under the 2015 agreement. Because of the US sanctions, Iran has actually lost all the benefits that it received as part of the agreement. It is likely that the resumption of nuclear activities will lead to a new deterioration of relations between Washington and Tehran. Today, investors will focus on the API report on oil reserves. The previous report reflected a sharp reduction by 5 million barrels, which was later not confirmed by the official report from the EIA.
Support and resistance
Bollinger Bands in the D1 chart demonstrate flat dynamics. The price range is trying to fix, reflecting the ambiguous dynamics of trading in the short term. MACD indicator is growing preserving a weak buy signal (histogram is above the signal line). Stochastic is showing a more confident growth and is located in the middle of its area.
The showings of the indicators do not contradict the possibility of further growth of the instrument in the short and/or ultra-short term.
Resistance levels: 64.73, 65.24, 65.98, 66.79.
Support levels: 64.00, 63.29, 62.67, 61.81, 60.27.


Trading tips
To open long positions, one can rely on the breakout of 64.73 or 65.24. Take profit – 66.79 or 67.38. Stop loss – 64.40–64.00.
A confident breakdown of 64.00 may serve as a signal for sales with the target at 62.67 or 61.81. Stop loss – 64.73.
Implementation period: 2-3 days.


No comments:
Write comments