AUD/USD: the instrument is growing
11 July 2019, 09:49
| Scenario | |
|---|---|
| Timeframe | Intraday |
| Recommendation | BUY STOP |
| Entry Point | 0.6990, 0.7010 |
| Take Profit | 0.7046 |
| Stop Loss | 0.6970, 0.6960 |
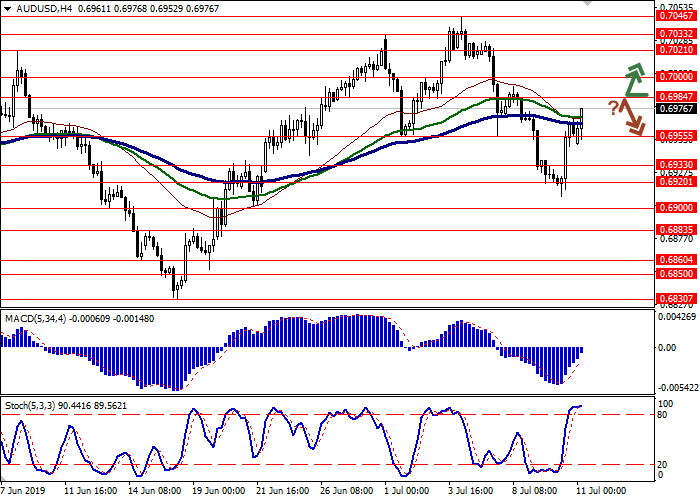
| Key Levels | 0.6900, 0.6920, 0.6933, 0.6955, 0.6984, 0.7000, 0.7021, 0.7033 |
| Alternative scenario | |
|---|---|
| Recommendation | SELL STOP |
| Entry Point | 0.6960, 0.6950 |
| Take Profit | 0.6920, 0.6900 |
| Stop Loss | 0.7000 |
| Key Levels | 0.6900, 0.6920, 0.6933, 0.6955, 0.6984, 0.7000, 0.7021, 0.7033 |
Current trend
The Australian dollar returned to a positive trend against the US one, having received support after the speech of Fed Chairman, which increased the risks of a rate cut during the meeting on July 30-31. AUD also ignored weak macroeconomic publications from Australia. Westpac consumer confidence index in July showed a decline of 4.1% MoM after declining by 0.6% MoM last month.
Today, the instrument maintains upward dynamics. Moderate support for the "Australian" provides data on the dynamics of mortgage loans. In May, the indicator reached the zero level after a decline of 0.9% MoM in April. Analysts were expecting a decline of 0.6% MoM. Investment loans for the construction of new homes in May declined by 1.7% MoM after declining by 2.2% MoM last month.
Support and resistance
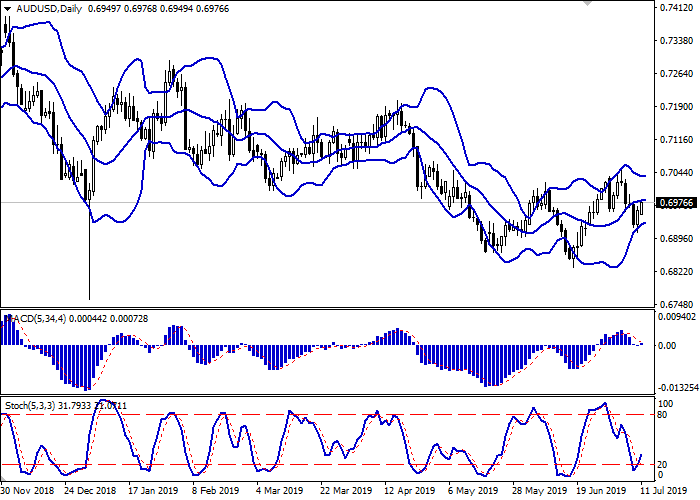
On the D1 chart, Bollinger Bands are reversing horizontally. The price range is narrowing, reflecting the ambiguous dynamics of trading in the short term. MACD indicator is trying again to reverse upwards and to form a new buy signal (the histogram has to consolidate above the signal line). Stochastic, having approached its minima, also reversed upwards.
The showings of the indicators do not contradict the further development of the upward trend in the short and/or ultra-short term.
Resistance levels: 0.6984, 0.7000, 0.7021, 0.7033.
Support levels: 0.6955, 0.6933, 0.6920, 0.6900.


Trading tips
To open long positions, one can rely on the breakout of 0.6984 or 0.7000. Take-profit – 0.7046. Stop loss – 0.6970–0.6960.
A rebound from 0.6984, as from resistance, followed by a breakdown of 0.6965–0.6955, may become a signal for corrective sales with the target at 0.6920–0.6900. Stop loss – 0.7000.
Implementation period: 2-3 days.
The Australian dollar returned to a positive trend against the US one, having received support after the speech of Fed Chairman, which increased the risks of a rate cut during the meeting on July 30-31. AUD also ignored weak macroeconomic publications from Australia. Westpac consumer confidence index in July showed a decline of 4.1% MoM after declining by 0.6% MoM last month.
Today, the instrument maintains upward dynamics. Moderate support for the "Australian" provides data on the dynamics of mortgage loans. In May, the indicator reached the zero level after a decline of 0.9% MoM in April. Analysts were expecting a decline of 0.6% MoM. Investment loans for the construction of new homes in May declined by 1.7% MoM after declining by 2.2% MoM last month.
Support and resistance
On the D1 chart, Bollinger Bands are reversing horizontally. The price range is narrowing, reflecting the ambiguous dynamics of trading in the short term. MACD indicator is trying again to reverse upwards and to form a new buy signal (the histogram has to consolidate above the signal line). Stochastic, having approached its minima, also reversed upwards.
The showings of the indicators do not contradict the further development of the upward trend in the short and/or ultra-short term.
Resistance levels: 0.6984, 0.7000, 0.7021, 0.7033.
Support levels: 0.6955, 0.6933, 0.6920, 0.6900.


Trading tips
To open long positions, one can rely on the breakout of 0.6984 or 0.7000. Take-profit – 0.7046. Stop loss – 0.6970–0.6960.
A rebound from 0.6984, as from resistance, followed by a breakdown of 0.6965–0.6955, may become a signal for corrective sales with the target at 0.6920–0.6900. Stop loss – 0.7000.
Implementation period: 2-3 days.


No comments:
Write comments