USD/JPY: USD returned to decline
11 July 2019, 09:41
| Scenario | |
|---|---|
| Timeframe | Intraday |
| Recommendation | BUY STOP |
| Entry Point | 108.20 |
| Take Profit | 108.79, 108.95 |
| Stop Loss | 107.84 |
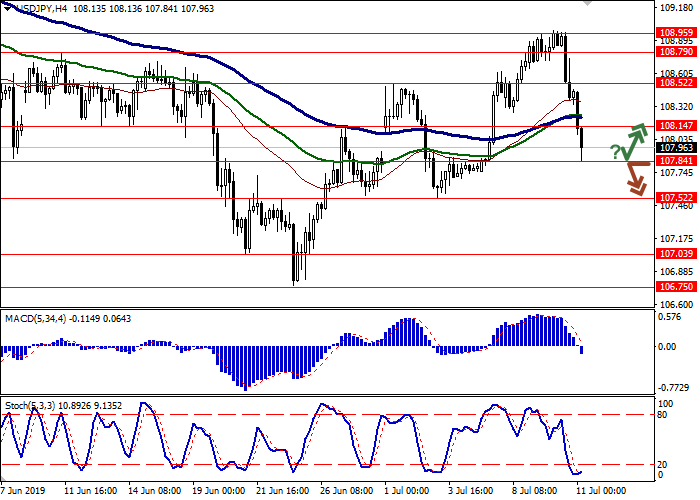
| Key Levels | 106.75, 107.03, 107.52, 107.84, 108.14, 108.52, 108.79, 108.95 |
| Alternative scenario | |
|---|---|
| Recommendation | SELL STOP |
| Entry Point | 107.75 |
| Take Profit | 107.03 |
| Stop Loss | 108.14 |
| Key Levels | 106.75, 107.03, 107.52, 107.84, 108.14, 108.52, 108.79, 108.95 |
Current trend
USD fell markedly against JPY on Wednesday. The reason for the emergence of negative dynamics was a sharp increase in the likelihood of a reduction in the Fed's interest rate during the meeting of July 30-31 amid the "dovish" rhetoric of Fed Chairman Jerome Powell. More active growth was hampered by the aggravation of the trade conflict between Japan and South Korea.
Today, there is also a negative trend, despite the publication of ambiguous macroeconomic statistics from Japan. Services PMI in Japan fell by 0.2% MoM in June after rising by 0.8% MoM last month. Analysts were expecting a decline of only 0.1% MoM. In turn, the rate of foreign investment in Japanese bonds supported the yen. For the week of July 5, the volume of investment rose from 58.5 to 192.2 billion JPY.
Support and resistance
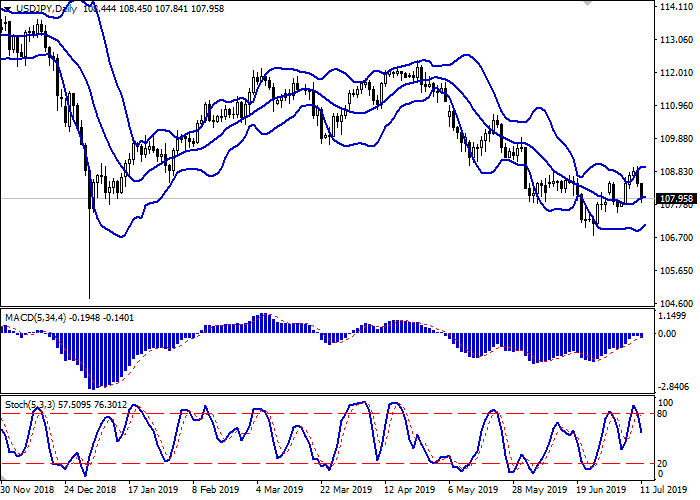
On the D1 chart, Bollinger Bands are reversing horizontally. The price range is narrowing, reflecting a sharp change of trend in the short/ultra-short term. MACD indicator is reversing downwards and tries to form a new buy signal (the histogram has to consolidate below the signal line). Stochastic demonstrates a more confident decline, being located approximately in the center of its working area, indicating prospects for a downward trend in the ultra-short term.
One should look at the possibility of downward dynamics at the end of the week.
Resistance levels: 108.14, 108.52, 108.79, 108.95.
Support levels: 107.84, 107.52, 107.03, 106.75.


Trading tips
Long positions may be opened if the price moves away from 107.84, as from support, followed by the breakout of 108.14. Take profit – 108.79 or 108.95. Stop loss – 107.84.
A confident breakdown of 107.84 may serve as a signal to further sales with the target at 107.03. Stop loss – 108.14.
Implementation period: 2-3 days.
USD fell markedly against JPY on Wednesday. The reason for the emergence of negative dynamics was a sharp increase in the likelihood of a reduction in the Fed's interest rate during the meeting of July 30-31 amid the "dovish" rhetoric of Fed Chairman Jerome Powell. More active growth was hampered by the aggravation of the trade conflict between Japan and South Korea.
Today, there is also a negative trend, despite the publication of ambiguous macroeconomic statistics from Japan. Services PMI in Japan fell by 0.2% MoM in June after rising by 0.8% MoM last month. Analysts were expecting a decline of only 0.1% MoM. In turn, the rate of foreign investment in Japanese bonds supported the yen. For the week of July 5, the volume of investment rose from 58.5 to 192.2 billion JPY.
Support and resistance
On the D1 chart, Bollinger Bands are reversing horizontally. The price range is narrowing, reflecting a sharp change of trend in the short/ultra-short term. MACD indicator is reversing downwards and tries to form a new buy signal (the histogram has to consolidate below the signal line). Stochastic demonstrates a more confident decline, being located approximately in the center of its working area, indicating prospects for a downward trend in the ultra-short term.
One should look at the possibility of downward dynamics at the end of the week.
Resistance levels: 108.14, 108.52, 108.79, 108.95.
Support levels: 107.84, 107.52, 107.03, 106.75.


Trading tips
Long positions may be opened if the price moves away from 107.84, as from support, followed by the breakout of 108.14. Take profit – 108.79 or 108.95. Stop loss – 107.84.
A confident breakdown of 107.84 may serve as a signal to further sales with the target at 107.03. Stop loss – 108.14.
Implementation period: 2-3 days.


No comments:
Write comments