
WTI Crude Oil: oil prices are falling
13 June 2019, 09:59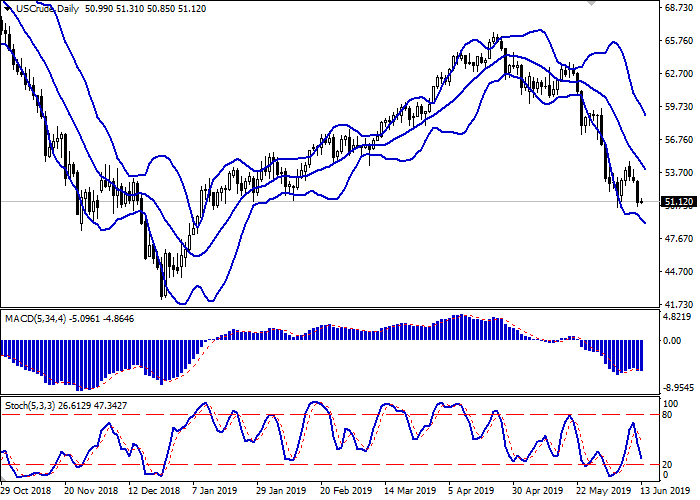
| Scenario | |
|---|---|
| Timeframe | Intraday |
| Recommendation | BUY STOP |
| Entry Point | 51.55, 52.05 |
| Take Profit | 54.73, 55.64 |
| Stop Loss | 50.00 |
| Key Levels | 48.05, 49.00, 50.00, 52.01, 53.19, 54.73, 55.64 |
| Alternative scenario | |
|---|---|
| Recommendation | SELL STOP |
| Entry Point | 49.95 |
| Take Profit | 48.05, 47.50 |
| Stop Loss | 51.30 |
| Key Levels | 48.05, 49.00, 50.00, 52.01, 53.19, 54.73, 55.64 |
Current trend
Yesterday, oil quotes declined steadily after the publication of a disappointing report from the US Department of Energy. According to it, the volume of oil and petroleum products in the US for the week of June 7 rose by 2.206 million barrels after rising by 6.771 million barrels over the previous period. Analysts had expected a decline of 0.481 million barrels. US production decreased from 12,400 to 12,300 million barrels per day. The forecast for the growth in energy demand for the second half of 2019 also decreased. In turn, the price is supported by the expectation of an extension of the OPEC+ agreement on limiting oil production. In addition, investors are optimistic about the development of the US-Chinese trade conflict and expect positive changes after the G20 summit, which will take place in late June.
Support and resistance
On the daily chart, Bollinger bands fall. The price range narrows slightly from the bottom but remains quite spacious for the current activity level. The MACD falls, keeping a poor sell signal (the histogram is below the signal line). Stochastic, which reversed downwards at the beginning of the week, is rapidly approaching its lows, reflecting that the instrument is oversold in the super-short term.
It is better to wait until the signals are clear.
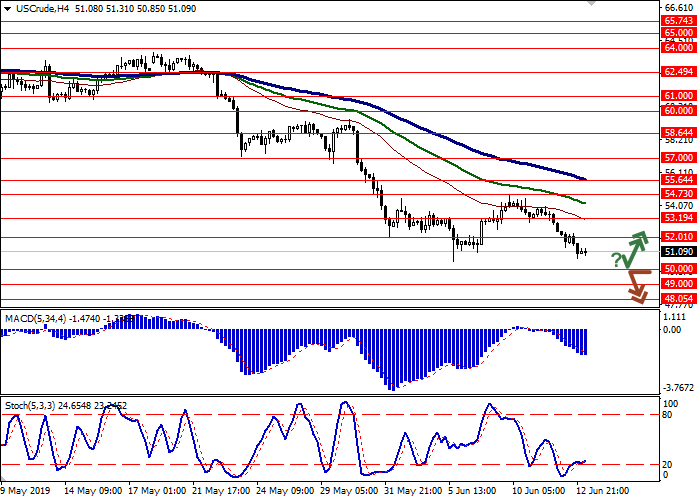
Resistance levels: 52.01, 53.19, 54.73, 55.64.
Support levels: 50.00, 49.00, 48.05.

Trading tips
Long positions can be opened after a rebound from 50.00 and a breakout of 51.50 or 52.01 with the target at 54.73 or 55.64. Stop loss – 50.00. Implementation period: 2–3 days.
Short positions can be opened after the breakdown of 50.00 with the target at 48.05 or 47.50. Stop loss – 51.30. Implementation period: 1–2 days.
Yesterday, oil quotes declined steadily after the publication of a disappointing report from the US Department of Energy. According to it, the volume of oil and petroleum products in the US for the week of June 7 rose by 2.206 million barrels after rising by 6.771 million barrels over the previous period. Analysts had expected a decline of 0.481 million barrels. US production decreased from 12,400 to 12,300 million barrels per day. The forecast for the growth in energy demand for the second half of 2019 also decreased. In turn, the price is supported by the expectation of an extension of the OPEC+ agreement on limiting oil production. In addition, investors are optimistic about the development of the US-Chinese trade conflict and expect positive changes after the G20 summit, which will take place in late June.
Support and resistance
On the daily chart, Bollinger bands fall. The price range narrows slightly from the bottom but remains quite spacious for the current activity level. The MACD falls, keeping a poor sell signal (the histogram is below the signal line). Stochastic, which reversed downwards at the beginning of the week, is rapidly approaching its lows, reflecting that the instrument is oversold in the super-short term.
It is better to wait until the signals are clear.
Resistance levels: 52.01, 53.19, 54.73, 55.64.
Support levels: 50.00, 49.00, 48.05.
Trading tips
Long positions can be opened after a rebound from 50.00 and a breakout of 51.50 or 52.01 with the target at 54.73 or 55.64. Stop loss – 50.00. Implementation period: 2–3 days.
Short positions can be opened after the breakdown of 50.00 with the target at 48.05 or 47.50. Stop loss – 51.30. Implementation period: 1–2 days.


No comments:
Write comments