GBP/USD: general review
13 June 2019, 10:23
| Scenario | |
|---|---|
| Timeframe | Intraday |
| Recommendation | SELL STOP |
| Entry Point | 1.2655 |
| Take Profit | 1.2580 |
| Stop Loss | 1.2695 |
| Key Levels | 1.2471, 1.2557, 1.2613, 1.2661, 1.2711, 1.2744, 1.2808, 1.2874, 1.2974 |
| Alternative scenario | |
|---|---|
| Recommendation | BUY STOP |
| Entry Point | 1.2705 |
| Take Profit | 1.2755 |
| Stop Loss | 1.2680 |
| Key Levels | 1.2471, 1.2557, 1.2613, 1.2661, 1.2711, 1.2744, 1.2808, 1.2874, 1.2974 |
Current trend
The pair continues to move within the "bearish" trend, despite the local weakness of the US dollar.
Yesterday, GBP could not take advantage of a negative release on consumer prices in the US. Traders massively locked an impressive amount of long positions, not finding a logical response to the published weak data. However, the decline in wage growth in the UK also indicates a slowdown in British inflation. This state of affairs is likely to force the British regulator to abandon plans to tighten monetary policy. Moreover, a member of the Bank of England’s Monetary Policy Committee, Michael Saunders, recently announced that the rate could be reduced to zero. At the moment, the political uncertainty around Brexit and the weakness of the UK economy have created strong pressure on the pound.
Today, at 14:30 (GMT+2), the release of the US labor market data is expected. Tomorrow at 14:30 and 15:15 (GMT+2) statistics on industrial production and retail sales in the US is expected.
Support and resistance
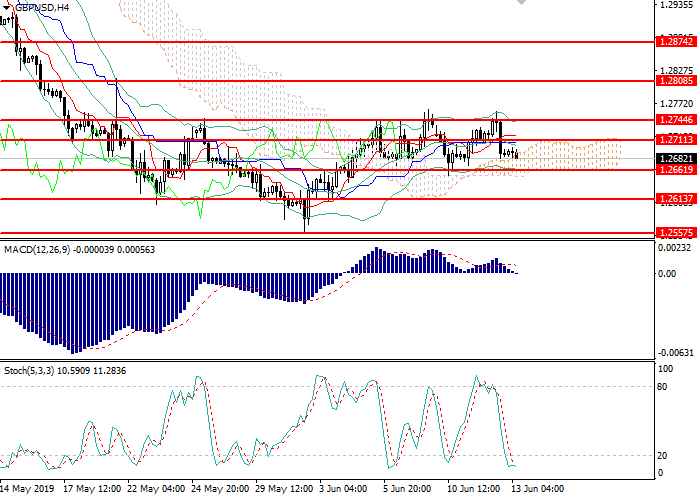
On the H4 chart the instrument is correcting in the lower part of Bollinger Bands. 1.2660 is a key support level, the breakdown of which will lead to the decline to the range of 1.2555–1.2580. Bollinger Bands reverse downwards, and the price range is limited, which indicates that the downward correction continues. MACD histogram is corrected near the zero level. Stochastic has entered the oversold area; a buy signal can be generated during the day.
Resistance levels: 1.2711, 1.2744, 1.2808, 1.2874, 1.2974.
Support levels: 1.2661, 1.2613, 1.2557, 1.2471.

Trading tips
Short positions may be opened below 1.2660 with target at 1.2580 and stop loss at 1.2695.
Long positions may be opened above 1.2700 with target at 1.2755 and stop loss at 1.2680.
Implementation time: 1-2 days.
The pair continues to move within the "bearish" trend, despite the local weakness of the US dollar.
Yesterday, GBP could not take advantage of a negative release on consumer prices in the US. Traders massively locked an impressive amount of long positions, not finding a logical response to the published weak data. However, the decline in wage growth in the UK also indicates a slowdown in British inflation. This state of affairs is likely to force the British regulator to abandon plans to tighten monetary policy. Moreover, a member of the Bank of England’s Monetary Policy Committee, Michael Saunders, recently announced that the rate could be reduced to zero. At the moment, the political uncertainty around Brexit and the weakness of the UK economy have created strong pressure on the pound.
Today, at 14:30 (GMT+2), the release of the US labor market data is expected. Tomorrow at 14:30 and 15:15 (GMT+2) statistics on industrial production and retail sales in the US is expected.
Support and resistance
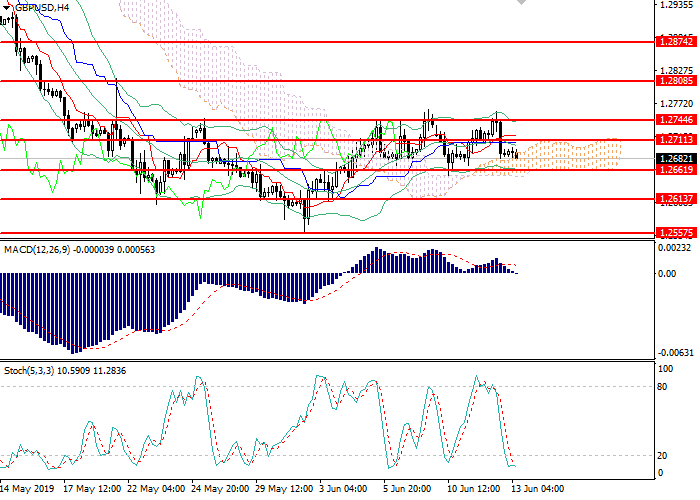
On the H4 chart the instrument is correcting in the lower part of Bollinger Bands. 1.2660 is a key support level, the breakdown of which will lead to the decline to the range of 1.2555–1.2580. Bollinger Bands reverse downwards, and the price range is limited, which indicates that the downward correction continues. MACD histogram is corrected near the zero level. Stochastic has entered the oversold area; a buy signal can be generated during the day.
Resistance levels: 1.2711, 1.2744, 1.2808, 1.2874, 1.2974.
Support levels: 1.2661, 1.2613, 1.2557, 1.2471.

Trading tips
Short positions may be opened below 1.2660 with target at 1.2580 and stop loss at 1.2695.
Long positions may be opened above 1.2700 with target at 1.2755 and stop loss at 1.2680.
Implementation time: 1-2 days.


No comments:
Write comments