USD/JPY: the instrument is consolidating
24 June 2019, 10:03
| Scenario | |
|---|---|
| Timeframe | Intraday |
| Recommendation | BUY STOP |
| Entry Point | 107.85, 108.10 |
| Take Profit | 108.79, 109.00 |
| Stop Loss | 107.40 |
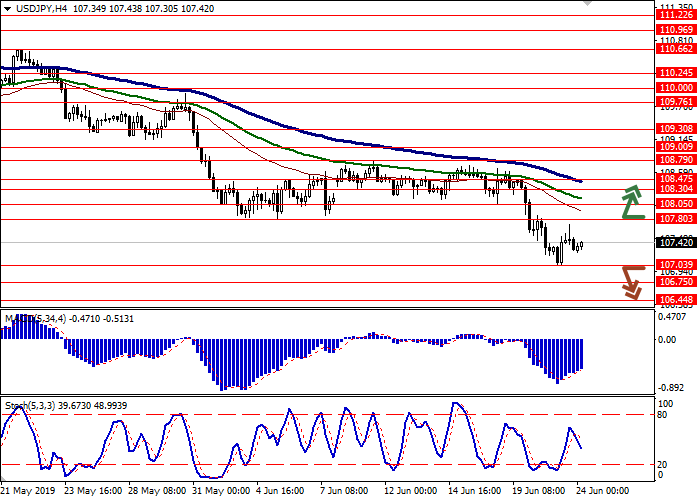
| Key Levels | 106.44, 106.75, 107.03, 107.80, 108.05, 108.30, 108.47 |
| Alternative scenario | |
|---|---|
| Recommendation | SELL STOP |
| Entry Point | 107.00 |
| Take Profit | 106.44, 106.15 |
| Stop Loss | 107.40 |
| Key Levels | 106.44, 106.75, 107.03, 107.80, 108.05, 108.30, 108.47 |
Current trend
The US dollar showed ambiguous dynamics against the yen at the end of the week, reversing near the updated local lows of the beginning of the year. The reason for the slowdown in the "bearish" dynamics was the technical correction, as well as the relatively weak macroeconomic statistics from Japan. Nikkei Manufacturing PMI in June fell from 49.8 to 49.5 points, which turned out to be worse than the expectations of 50.0 points. The growth of the national consumer price index in May slowed down from 0.9% YoY to 0.7% YoY, coinciding with analysts' forecasts.
Today, investors are focused on the publication of indexes of leading and coincident indicators in Japan in April. On June 25, the market is waiting for the publication of the minutes of the Bank of Japan meeting.
Support and resistance
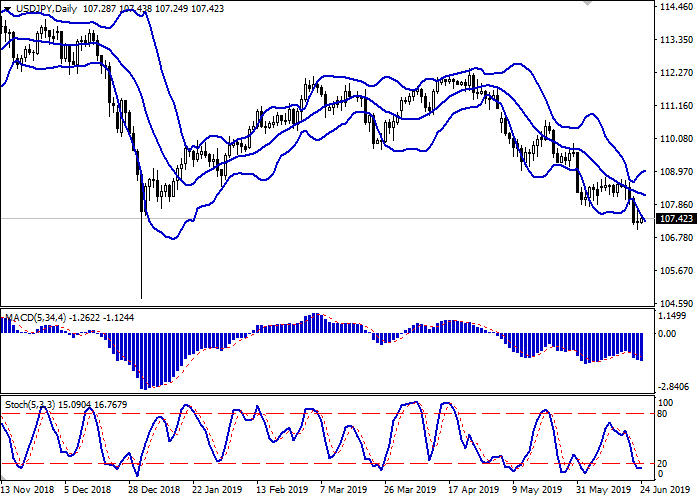
Bollinger Bands in D1 chart demonstrate a gradual decrease. The price range is actively expanding but fails to catch a burst of "bearish" sentiment at the end of last week. MACD is going down preserving a moderate sell signal (being located under the signal line). Stochastic, having consolidated below 20, reversed horizontally, indicating the risk of corrective growth in the ultra-short term.
One should wait for the clarification of the trading signals from the technical indicators.
Resistance levels: 107.80, 108.05, 108.30, 108.47.
Support levels: 107.03, 106.75, 106.44.


Trading tips
To open long positions, one can rely on the breakout of 107.80 or 108.05. Take profit – 108.79 or 109.00. Stop loss – 107.40.
The return of "bearish" dynamics with the breakdown of 107.03 may become a signal to start sales with the target at 106.44 or 106.15. Stop loss – 107.40.
Implementation period: 2-3 days.
The US dollar showed ambiguous dynamics against the yen at the end of the week, reversing near the updated local lows of the beginning of the year. The reason for the slowdown in the "bearish" dynamics was the technical correction, as well as the relatively weak macroeconomic statistics from Japan. Nikkei Manufacturing PMI in June fell from 49.8 to 49.5 points, which turned out to be worse than the expectations of 50.0 points. The growth of the national consumer price index in May slowed down from 0.9% YoY to 0.7% YoY, coinciding with analysts' forecasts.
Today, investors are focused on the publication of indexes of leading and coincident indicators in Japan in April. On June 25, the market is waiting for the publication of the minutes of the Bank of Japan meeting.
Support and resistance
Bollinger Bands in D1 chart demonstrate a gradual decrease. The price range is actively expanding but fails to catch a burst of "bearish" sentiment at the end of last week. MACD is going down preserving a moderate sell signal (being located under the signal line). Stochastic, having consolidated below 20, reversed horizontally, indicating the risk of corrective growth in the ultra-short term.
One should wait for the clarification of the trading signals from the technical indicators.
Resistance levels: 107.80, 108.05, 108.30, 108.47.
Support levels: 107.03, 106.75, 106.44.


Trading tips
To open long positions, one can rely on the breakout of 107.80 or 108.05. Take profit – 108.79 or 109.00. Stop loss – 107.40.
The return of "bearish" dynamics with the breakdown of 107.03 may become a signal to start sales with the target at 106.44 or 106.15. Stop loss – 107.40.
Implementation period: 2-3 days.


No comments:
Write comments