XAU/USD: gold prices are rising
24 June 2019, 10:00
| Scenario | |
|---|---|
| Timeframe | Intraday |
| Recommendation | BUY STOP |
| Entry Point | 1411.60 |
| Take Profit | 1440.00 |
| Stop Loss | 1393.75 |
| Key Levels | 1357.90, 1382.22, 1393.75, 1400.00, 1411.57, 1425.00 |
| Alternative scenario | |
|---|---|
| Recommendation | SELL STOP |
| Entry Point | 1399.95, 1393.75 |
| Take Profit | 1357.90, 1347.94 |
| Stop Loss | 1415.00 |
| Key Levels | 1357.90, 1382.22, 1393.75, 1400.00, 1411.57, 1425.00 |
Current trend
At the end of last week, gold prices renewed its record highs, supported by the aggravated geopolitical situation in the Middle East. Markets reacted violently to the incident with the American drone downed by Iranian air defenses. At a minimum, investors expect a strengthening of US sanctions but also fear more decisive action by Donald Trump. Also, gold is supported by the “dovish” rhetoric of the world's leading central banks, which the Fed has joined, announcing a possible rate cut as early as the July meeting.
This week, traders will focus on the G20 Summit in Japan. Donald Trump and the head of the People's Republic of China Xi Jinping can meet at the forum to discuss the trade conflict that has escalated between the countries.
Support and resistance
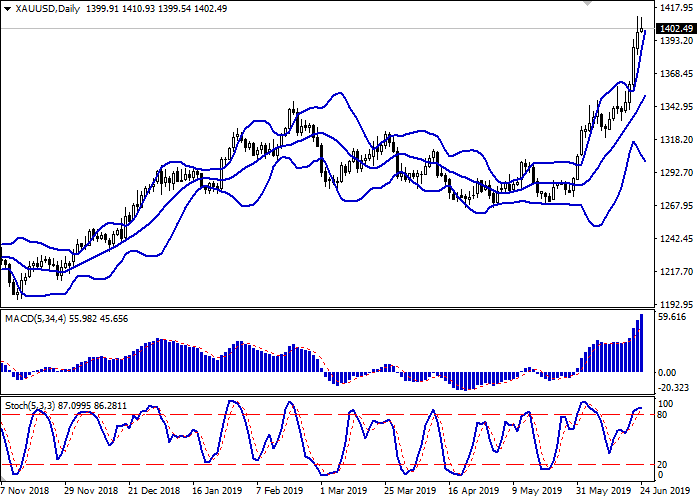
Bollinger bands actively grow on the daily chart. The price range expands expanding but not as fast as the "bullish" dynamics develop. The MACD grows, keeping a strong buy signal (the histogram is above the signal line). Stochastic, approaching its highs, tends to reverse into a horizontal plane, signaling that the instrument is strongly overbought in the super short term.
It is better to keep current long positions and not to open new ones in the short term until the situation is clear.
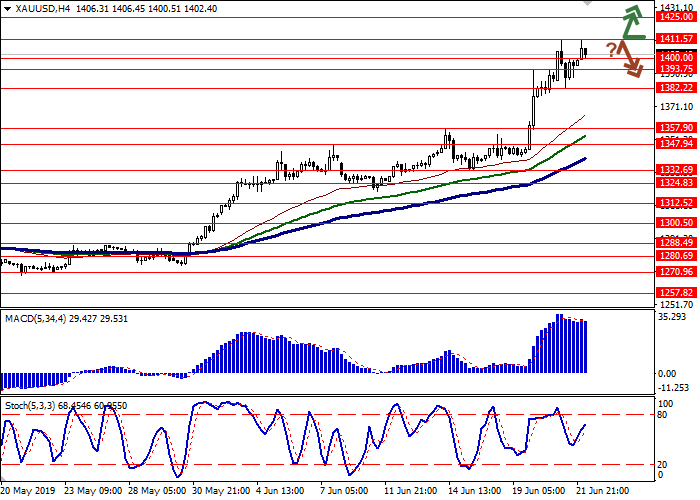
Resistance levels: 1411.57, 1425.00.
Support levels: 1400.00, 1393.75, 1382.22, 1357.90.


Trading tips
Long positions can be opened after the breakout of 1411.57 with the target at 1425.00 or 1440.00. Stop loss is 1393.75. Implementation period: 1–2 days.
Short positions can be opened after the rebound from 1411.57 and the breakdown of 1400.00 or 1393.75 with the target at 1357.90 or 1347.94. Stop loss is 1411.57 or 1415.00.
Implementation period: 2–3 days.
At the end of last week, gold prices renewed its record highs, supported by the aggravated geopolitical situation in the Middle East. Markets reacted violently to the incident with the American drone downed by Iranian air defenses. At a minimum, investors expect a strengthening of US sanctions but also fear more decisive action by Donald Trump. Also, gold is supported by the “dovish” rhetoric of the world's leading central banks, which the Fed has joined, announcing a possible rate cut as early as the July meeting.
This week, traders will focus on the G20 Summit in Japan. Donald Trump and the head of the People's Republic of China Xi Jinping can meet at the forum to discuss the trade conflict that has escalated between the countries.
Support and resistance
Bollinger bands actively grow on the daily chart. The price range expands expanding but not as fast as the "bullish" dynamics develop. The MACD grows, keeping a strong buy signal (the histogram is above the signal line). Stochastic, approaching its highs, tends to reverse into a horizontal plane, signaling that the instrument is strongly overbought in the super short term.
It is better to keep current long positions and not to open new ones in the short term until the situation is clear.
Resistance levels: 1411.57, 1425.00.
Support levels: 1400.00, 1393.75, 1382.22, 1357.90.


Trading tips
Long positions can be opened after the breakout of 1411.57 with the target at 1425.00 or 1440.00. Stop loss is 1393.75. Implementation period: 1–2 days.
Short positions can be opened after the rebound from 1411.57 and the breakdown of 1400.00 or 1393.75 with the target at 1357.90 or 1347.94. Stop loss is 1411.57 or 1415.00.
Implementation period: 2–3 days.


No comments:
Write comments