USD/CAD: ambiguous dynamics
24 June 2019, 10:05
| Scenario | |
|---|---|
| Timeframe | Intraday |
| Recommendation | BUY STOP |
| Entry Point | 1.3265, 1.3255 |
| Take Profit | 1.3356 |
| Stop Loss | 1.3200, 1.3180 |
| Key Levels | 1.3067, 1.3100, 1.3149, 1.3200, 1.3228, 1.3250, 1.3283 |
| Alternative scenario | |
|---|---|
| Recommendation | SELL STOP |
| Entry Point | 1.3140 |
| Take Profit | 1.3067, 1.3030 |
| Stop Loss | 1.3200 |
| Key Levels | 1.3067, 1.3100, 1.3149, 1.3200, 1.3228, 1.3250, 1.3283 |
Current trend
On Friday, USD rose moderately against CAD, partially balancing a steady decline in the instrument the previous day. The appearance of "bullish" dynamics was due to the technical correction, as well as disappointing macroeconomic statistics from Canada. Retail sales in April rose by only 0.1% MoM after rising by 1.3% MoM last month, which almost coincided with the forecast of +0.2% MoM. Without car sales, the sales figure also slowed from +1.8% MoM to +0.1% MoM, while the forecast was +0.3% MoM.
American statistics disappointed traders with Markit June business activity index but supported the consumer sentiment with housing market data. In May, Existing Homes Sales rose by 2.5% MoM after zero dynamics last month. Analysts had expected growth only by +1.2% MoM.
Support and resistance
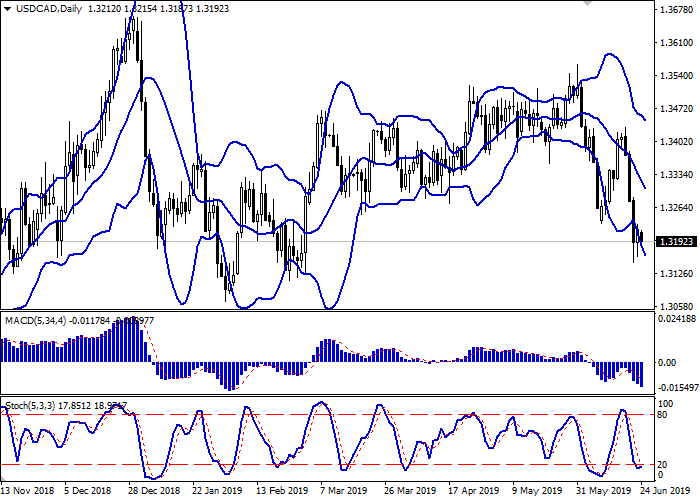
On the daily chart, Bollinger bands are steadily declining. The price range is virtually unchanged but remains quite spacious for the current level of activity in the market. The MACD indicator is going downwards, keeping a moderate sell signal (the histogram is below the signal line). Stochastic, approaching its lows, is trying to reverse upwards, indicating that the instrument is strongly oversold in the super-short term.
Corrective growth is possible in the nearest time intervals.
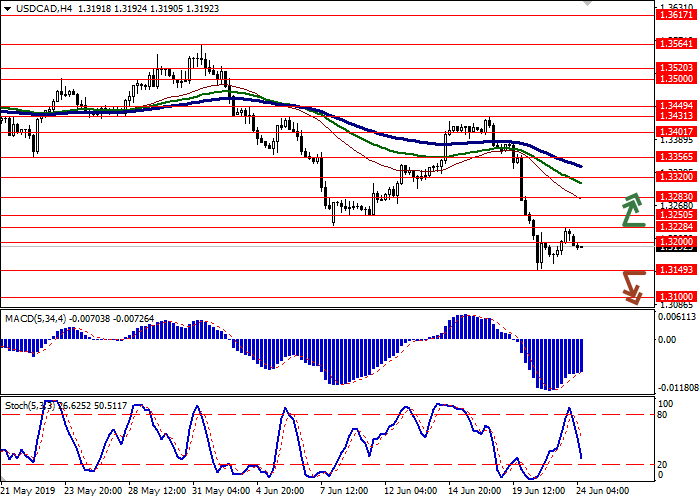
Resistance levels: 1.3200, 1.3228, 1.3250, 1.3283.
Support levels: 1.3149, 1.3100, 1.3067.


Trading tips
Long positions can be opened after the breakout of the level of 1.3228 or 1.3250 with the target at 1.3356. Stop loss is 1.3200 or 1.3180.
Short positions can be opened after the breakdown of the level of 1.3149 with the targets at 1.3067–1.3030. Stop loss is 1.3200.
Implementation period: 2–3 days.
On Friday, USD rose moderately against CAD, partially balancing a steady decline in the instrument the previous day. The appearance of "bullish" dynamics was due to the technical correction, as well as disappointing macroeconomic statistics from Canada. Retail sales in April rose by only 0.1% MoM after rising by 1.3% MoM last month, which almost coincided with the forecast of +0.2% MoM. Without car sales, the sales figure also slowed from +1.8% MoM to +0.1% MoM, while the forecast was +0.3% MoM.
American statistics disappointed traders with Markit June business activity index but supported the consumer sentiment with housing market data. In May, Existing Homes Sales rose by 2.5% MoM after zero dynamics last month. Analysts had expected growth only by +1.2% MoM.
Support and resistance
On the daily chart, Bollinger bands are steadily declining. The price range is virtually unchanged but remains quite spacious for the current level of activity in the market. The MACD indicator is going downwards, keeping a moderate sell signal (the histogram is below the signal line). Stochastic, approaching its lows, is trying to reverse upwards, indicating that the instrument is strongly oversold in the super-short term.
Corrective growth is possible in the nearest time intervals.
Resistance levels: 1.3200, 1.3228, 1.3250, 1.3283.
Support levels: 1.3149, 1.3100, 1.3067.


Trading tips
Long positions can be opened after the breakout of the level of 1.3228 or 1.3250 with the target at 1.3356. Stop loss is 1.3200 or 1.3180.
Short positions can be opened after the breakdown of the level of 1.3149 with the targets at 1.3067–1.3030. Stop loss is 1.3200.
Implementation period: 2–3 days.


No comments:
Write comments