USD/JPY: dollar recovers
27 June 2019, 10:05
| Scenario | |
|---|---|
| Timeframe | Intraday |
| Recommendation | BUY STOP |
| Entry Point | 108.35 |
| Take Profit | 109.00, 109.30 |
| Stop Loss | 108.00 |
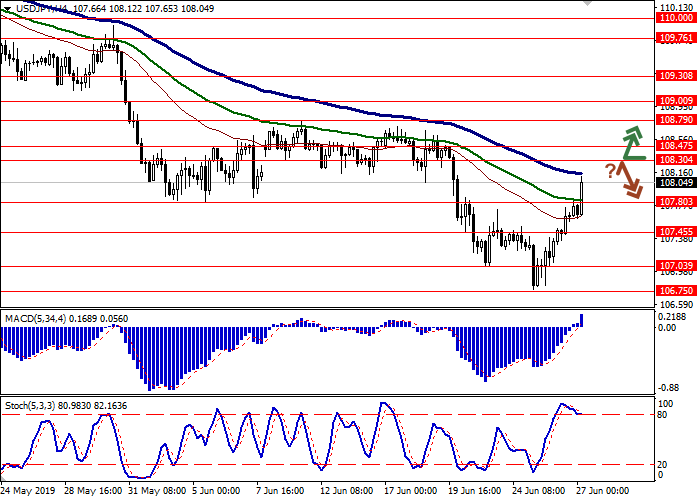
| Key Levels | 106.75, 107.03, 107.45, 107.80, 108.30, 108.47, 108.79, 109.00 |
| Alternative scenario | |
|---|---|
| Recommendation | SELL STOP |
| Entry Point | 107.95 |
| Take Profit | 107.20, 107.00 |
| Stop Loss | 108.30, 108.40 |
| Key Levels | 106.75, 107.03, 107.45, 107.80, 108.30, 108.47, 108.79, 109.00 |
Current trend
Yesterday, USD rose strongly against JPY, departing from local lows renewed the day before. USD was supported by increased expectations of a favorable outcome of the planned meeting of Donald Trump and Xi Jinping during the G20 summit, which will be held at the end of the week, and by the speech of Fed Chairman Jerome Powell, who did not focus on the prospects for interest rate decrease during the July meeting but also noted that the regulator will not react to any political pressure. Today, the instrument continues to grow, despite the publication of optimistic macroeconomic statistics from Japan. May’s Retail sales increased by 0.3% MoM and 1.2% YoY after a decline of 0.1% MoM and growth by 0.4% YoY last month. Analysts expected it to worsen to –0.6% MoM. May’s Retail Sales is large stores decreased by 0.5% MoM against the previous value of –1.8% MoM with the forecast of –1.2% MoM.
Support and resistance
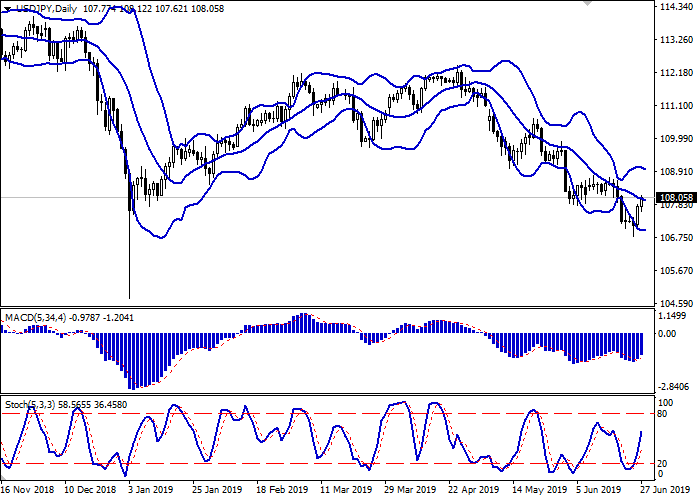
On the daily chart, Bollinger bands reverse horizontally. The price range narrows in response to a change in the direction of trading in the short term. The MACD reversed upwards, forming a new buy signal (the histogram is above the signal line). Stochastic is directed upwards, approaching its highs.
The current readings of the indicators do not contradict the further development of the “bullish” dynamics in the short and/or super short term.
Resistance levels: 108.30, 108.47, 108.79, 109.00.
Support levels: 107.80, 107.45, 107.03, 106.75.


Trading tips
Long positions can be opened after the breakout of 108.30 with the target at 109.00 or 109.30. Stop loss is 108.00.
Short positions can be opened after the rebound from 108.30 and the breakdown of 108.00 with the targets at 107.20–107.00. Stop loss is 108.30–108.40.
Implementation period: 2–3 days.
Yesterday, USD rose strongly against JPY, departing from local lows renewed the day before. USD was supported by increased expectations of a favorable outcome of the planned meeting of Donald Trump and Xi Jinping during the G20 summit, which will be held at the end of the week, and by the speech of Fed Chairman Jerome Powell, who did not focus on the prospects for interest rate decrease during the July meeting but also noted that the regulator will not react to any political pressure. Today, the instrument continues to grow, despite the publication of optimistic macroeconomic statistics from Japan. May’s Retail sales increased by 0.3% MoM and 1.2% YoY after a decline of 0.1% MoM and growth by 0.4% YoY last month. Analysts expected it to worsen to –0.6% MoM. May’s Retail Sales is large stores decreased by 0.5% MoM against the previous value of –1.8% MoM with the forecast of –1.2% MoM.
Support and resistance
On the daily chart, Bollinger bands reverse horizontally. The price range narrows in response to a change in the direction of trading in the short term. The MACD reversed upwards, forming a new buy signal (the histogram is above the signal line). Stochastic is directed upwards, approaching its highs.
The current readings of the indicators do not contradict the further development of the “bullish” dynamics in the short and/or super short term.
Resistance levels: 108.30, 108.47, 108.79, 109.00.
Support levels: 107.80, 107.45, 107.03, 106.75.


Trading tips
Long positions can be opened after the breakout of 108.30 with the target at 109.00 or 109.30. Stop loss is 108.00.
Short positions can be opened after the rebound from 108.30 and the breakdown of 108.00 with the targets at 107.20–107.00. Stop loss is 108.30–108.40.
Implementation period: 2–3 days.


No comments:
Write comments